Applying Gating and Statistics
In this section, you will learn how to apply a gate to a kinetics plot and view kinetics statistics for the gate.
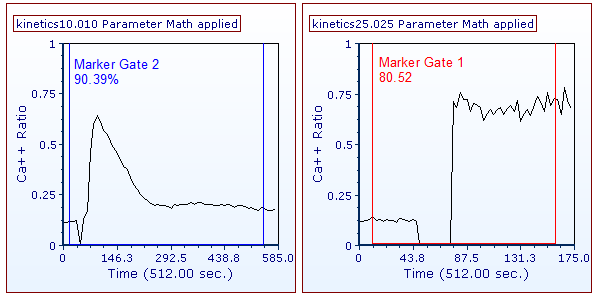
Although any kinetics data files of your own can be used to follow along, you have the option of using the same sample data files used in this tutorial. The sample data files are located in the Tutorial Sample Data archive. The KineticsTutorial.fey, kinetics10.010, and kinetics25.025 data files will be used here. Please complete the steps in the Using Parameter Math section before beginning.
1. Choose the Gating tab→Create Gates group→Marker command  .
.
2. Create a 1D (marker) gate on sample kinetics25.025, similar to the one in Figure T23.12, so its left boundary defines the baseline and its right boundary is after the peak has subsided.
3. Enter "Marker Gate 1" in the Create a new gate named edit field in the Create New Gate dialog.
4. Click OK to accept.
5. Choose the Gating tab→Create Gates group→Marker command.
6. Create a 1D (marker) gate on sample kinetics10.010, similar to the one in Figure T23.12, so its left boundary defines the baseline and its right boundary is after the peak has subsided.
7. Enter "Marker Gate 2" in the Create a new gate named edit field in the Create New Gate dialog.
8. Click OK.

Figure T23.12 Kinetics Plots with 1D Gates Applied
9. Right-click the kinetics25.025 plot.
10. Choose Statistics→Kinetics Statistics.
A Kinetics Statistics window will appear on the layout.
11. Move the Kinetics Statistics window to a convenient position on the layout.
12. Right-click the kinetics10.010 plot.
13. Choose Statistics→Kinetics Statistics.
A Kinetics Statistics window will appear on the layout.
14. Move the Kinetics Statistics window to a convenient position on the layout.
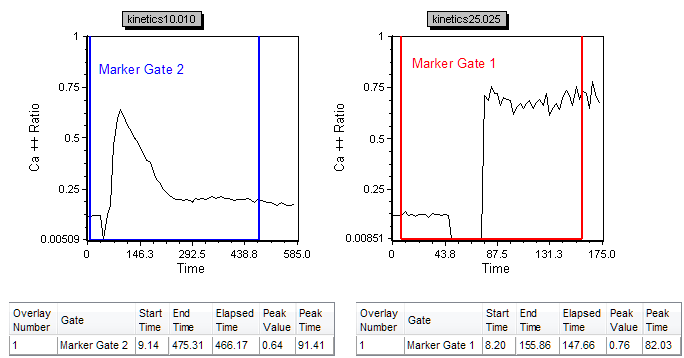
The layout should resemble Figure T23.13.

Figure T23.13 Plots with Kinetics Statistics Windows
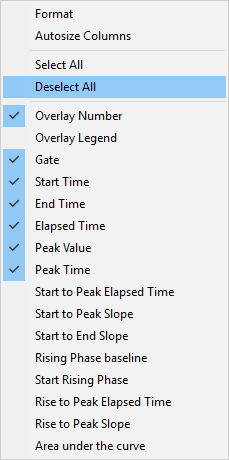
By right-clicking the Kinetics Statistics window, you may choose to view up to 14 different kinetics statistics (Figure T23.14). These values will change dynamically gate adjustments or changes in data displayed.

Figure T23.14 Kinetics Statistics Right-Click Popup Menu
Next, we will explore different plotting values.
