Axis Options
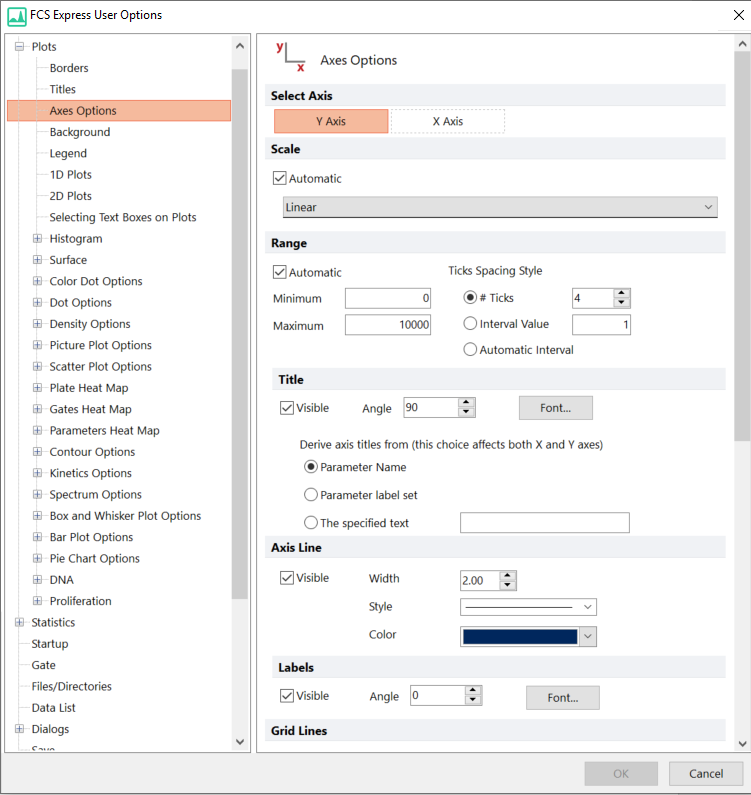
This category controls the default Axis Options for plots. The options are explained below and pictured in Figure 20.8. If you commonly work with data files in both the FCS 2.0 and FCS 3.0 standards, you may also need to set different default options for each of these file types. These default options can be found in the Instrument Specific Settings.

Figure 20.8 Edit Preferences - Axis Options
By default, clicking on the axis label of a plot will allow you to change the parameter for that axis. While this is convenient for users who are designing layouts, parameters may be accidentally changed on occasion. You can force the Alt key to be required to change parameters by checking the Alt+Click Required To Change Axis Parameters check box.
Technical note: Axis Scale and Statistics
In FCS Express, all the statistics are calculated on the raw data, irrespective of the display scaling. However, when Gates and Quadrants are created decisions must be made in cases where an event falls on the line of the gate or quadrant.
In FCS Express, Gates and Quadrants are calculated and drawn in a binned space with binning dependent on both the Scaling and the Resolution Minimum/Maximum of the plot. In turn, the inclusion or exclusion of an event on the border line of a gate or in a quadrant is highly dependent on the scaling of the plot, and on the Resolution Minimum/Maximum, of the plot the Gate/Quadrants was drawn on.
When adjustments to the scaling or resolution of a plot are made, an event may then fall to a different side of the border line of the gate/quadrant, and the user may notice very slight changes in the statistics of gated events which are usually quite minimal and make no impact on the interpretation of the results.
Please refer to the Axis Scale and Statistics chapter for more details.
