Create Token Classifiers
Classifier Tokens are only available in the Clinical Edition (IVD version) of FCS Express. Please contact support@denovosoftware.com if you would like more information on FCS Express Clinical Edition and access to the Creating Token Classifiers tutorial.
In this section, we will:
•Create token classifiers using custom tokens.
•Insert token classifiers into the new Spreadsheet.
Note: Token Classifiers are only included with clinical licenses of FCS Express.
Using the 'BShift' and 'TShift' Custom Token data created in the last section, we will now define token classifiers ('NEG', 'POS', and 'WEAK') in the Spreadsheet. We will use the token classifiers to classify our samples and ultimately determine the status of the patient serum cross-match. To begin, we will insert a new Spreadsheet.
1.Open the HLA_Custom_Tokens_Completed.fey layout found in the Tutorial Sample Data archive folder.
We will now begin defining Token Classifiers to classify the results for each sample in the bottom spreadsheet of Page 3 of the layout. For more information on creating Token Classifiers, see the Using Text boxes and Tokens Tutorial.
2. Click on the Page 3 tab.
3. Right-click cell B1.
4. Choose Insert Token.
Note: The Insert a Token dialog appears as in Figure T16.29.
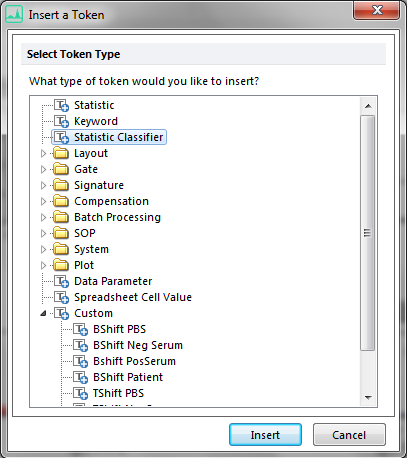
Figure T16.29 Insert a Token - Statistical Classifier
5. Select Statistic Classifier from the Insert a Token dialog.
6. Click Insert.
The Classification category of the Create Statistic Classifier dialog appears, as shown in Figure T16.30. We will begin to define the Statistic Classifier to classify our results as either "NEG," "WEAK," or "POS." However, we first need to define which statistic we want to classify.
7. Click on the ![]() T/Token icon (shown by the cursor in FigureT16.30) under the "Enter a value to classify:" field.
T/Token icon (shown by the cursor in FigureT16.30) under the "Enter a value to classify:" field.
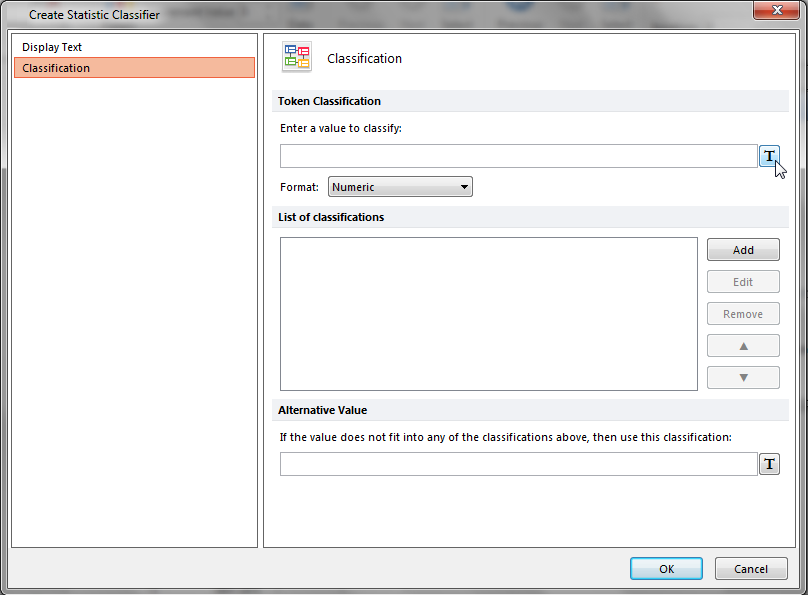
Figure T16.30 Create Statistic Classifier Dialog - Classification Category
Note: The Insert a Token dialog reappears, as shown in Figure T16.31. We will choose the Custom Token for our Token Classifier to classify.
8. Select BShift PBS from the Custom category of the Insert a Token dialog, shown highlighted in blue in Figure T16.31.
9. Click Insert.
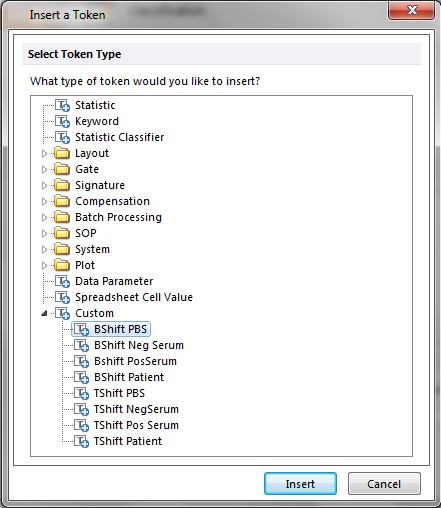
Figure T15.31 Insert a Token Dialog with Custom Tokens to Classify
Note: The Classification category of the Create Statistic Classifier dialog reappears. The 'Enter a value to classify:' field has the Custom Token 'BShift PBS' entry, as shown in Figure T16.32. We will now enter the specific list of classifiers to use.
10. Click the Add button, indicated by the cursor in Figure T16.32.
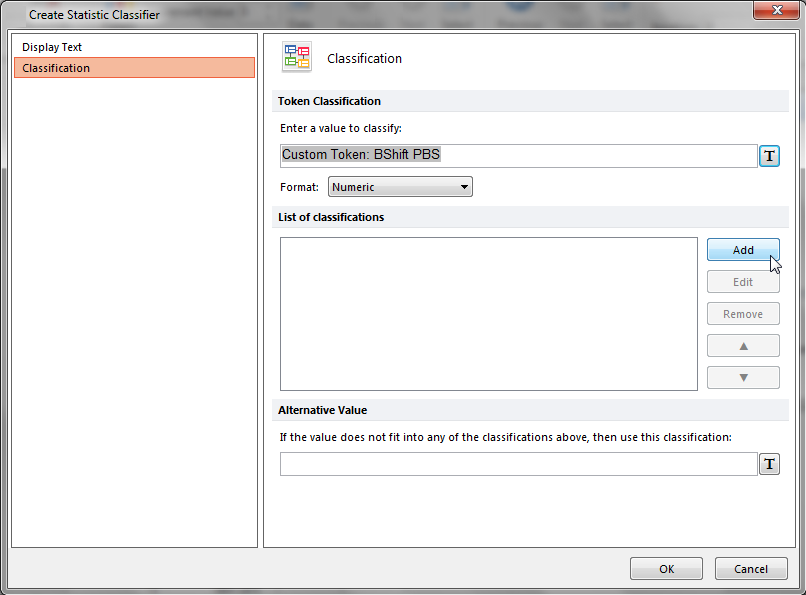
Figure T16.32 Adding the List of Classifiers in the Create Statistic Classifier Dialog
The Create Classification dialog appears. Please refer to Figure T16.33 for the following steps;
11.Type NEG in the Classify the token as text field.
12. Type 0 in the if its value is between text field.
13. Type 19999 in the and text field.
14. Click OK.

Figure T16.33 Edit Classification Dialog
Note: The Classification category of the Edit Statistic Classifier dialog appears. However, now the List of classifications: field has the 'NEG' definition listed. We have just defined the 'NEG' classification for the 'BShift' Custom Token to be between 0 and 19,999. This means that if the sample's MESF FITC median fluorescence value of the B-cells, adjusted by the PBS NEGATIVE CONTROL, is less than 20,000 it is classified as negative or 'NEG'.
We will now continue to define the two other classification categories of 'WEAK' and 'POS'.
15. Click the Add button.
16. Type WEAK in the Classify the token as text field of the Create Classification dialog.
17. Type 20000 in the if its value is between text field.
18. Type 49999 in the and text field.
19. Click OK.
20. Click the Add button.
21. Type POS in the Classify the token as text field.
22. Type 50000 in the if its value is between text field.
23. Type 1200000 in the and text field.
24. Click OK.
The Edit Statistic Classifier dialog should now appear similar to Figure T16.34 with the complete classifier definition for the 'BShift' Custom Tokens.
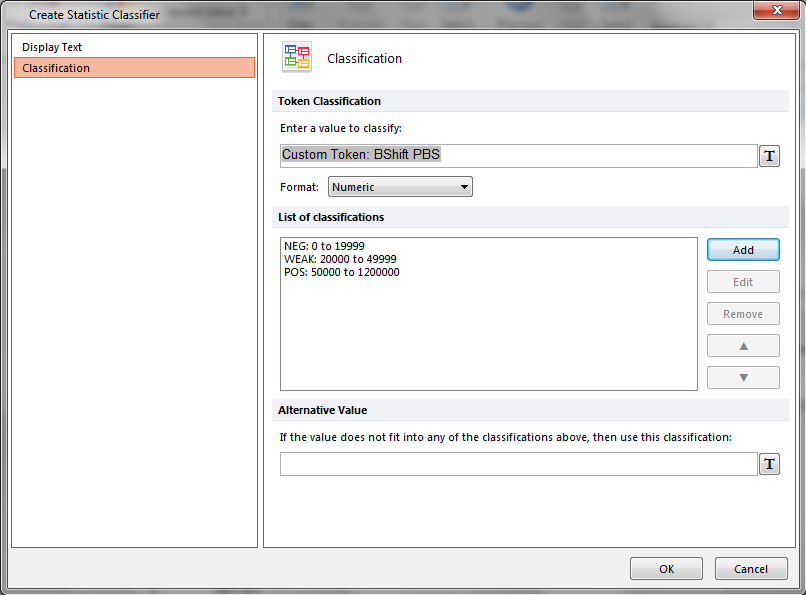
Figure T16.34 The 'B Result' Token Classifier Definition
25. Click OK on the Edit Statistic Classifier dialog to accept the definition.
The 'HLA' Spreadsheet now updates to reflect the addition of the Token Classifier to the first cell of the 'B' column as shown in Figure T16.35.
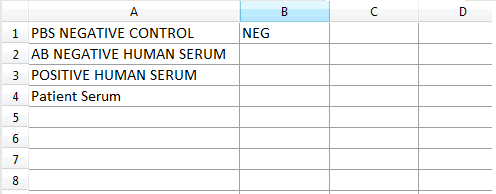
Figure T16.35 Token Classifier for the 'B' Column
Note: We have created the Token Classifier to use for the 'B1' cell. However, we will need to edit the Token Classifier to use the appropriate sample data for the remaining 3 classifications for AB Negative Human Serum, Positive Human Serum, and Patient Serum (B2, B3 and B4, respectively).
To define the statistical classifier for the remaining cells:
26. Right-click cell B2.
27. Repeat Steps 4-25 to define to a statistical classifier for BShift Neg Serum.
Note: for step 8, choose BShift Neg Serum instead of BShift PBS and use the same classifier values and names as listed in the above steps.
28. Right-click cell B3.
29. Repeat Steps 4-25 to define to a statistical classifier for BShift PosSerum.
Note: for step 8, choose "BShift PosSerum" instead of BShift PBS and use the same classifier values and names as listed in the above steps.
30. Right click in cell 'B4'.
31. Repeat Steps 4-25 to define to a statistical classifier for BShift Patient.
Note: for step 8, choose "BShift Patient" instead of BShift PBS and use the same classifier values and names as listed in the above steps. The spreadsheet should now look like Figure T16.36 below. As the Lymphs gate is adjusted in the layout, you will notice the statistic classifiers updating in real-time as the statistics change.

Figure T16.36 Spreadsheet Complete
