Exporting Plots to PowerPoint
In the course of this example, we will:
•Create a Data List of files to be batch processed.
•Export plots to a PowerPoint file.
To Run a Batch Processing Action:
1.Click the File tab→Open.
2.Open the layout BatchProcess.fey found in the Tutorial Sample Data archive.
This layout contains two 2D density plots and a histogram of the file TCellSample1.fcs (Figure T10.1). The left plot is of SSC-A vs PerCP-Cy5.5-A with a gate on Lymphs. The right plot is of PE-A vs. APC-A gated on Lymphs with quadrants. The histogram of FITC-A is also gated on Lymphs.
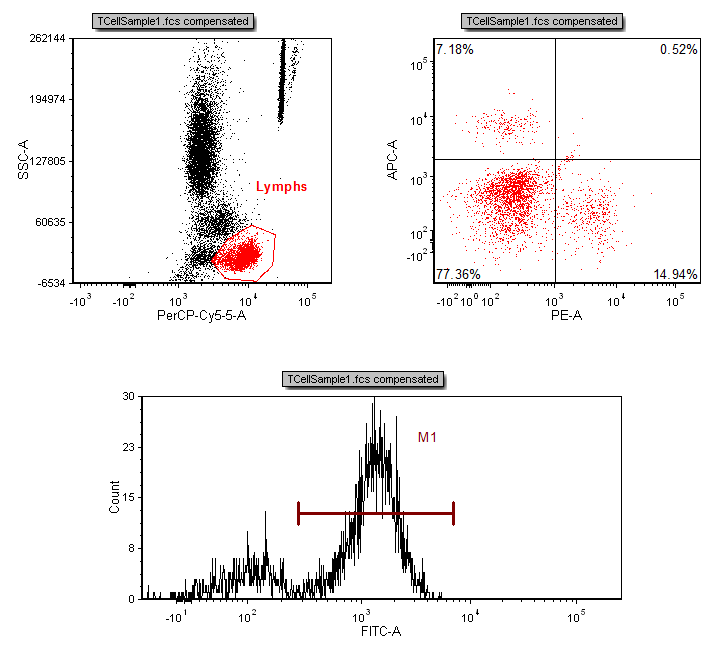
Figure T10.1 Batch Layout (BatchProcess.fey)
In order to run a batch process, you need to load files into the Data List.
3. Select the Data tab→Organize Data Sets group→Data List command ![]() .
.
A Data List window will appear with a sample named TCellSample1.fcs in it.
4.Click the blue plus sign to add files ![]() and select Add Data File.
and select Add Data File.
The Select data file dialog will appear (Figure T10.4).
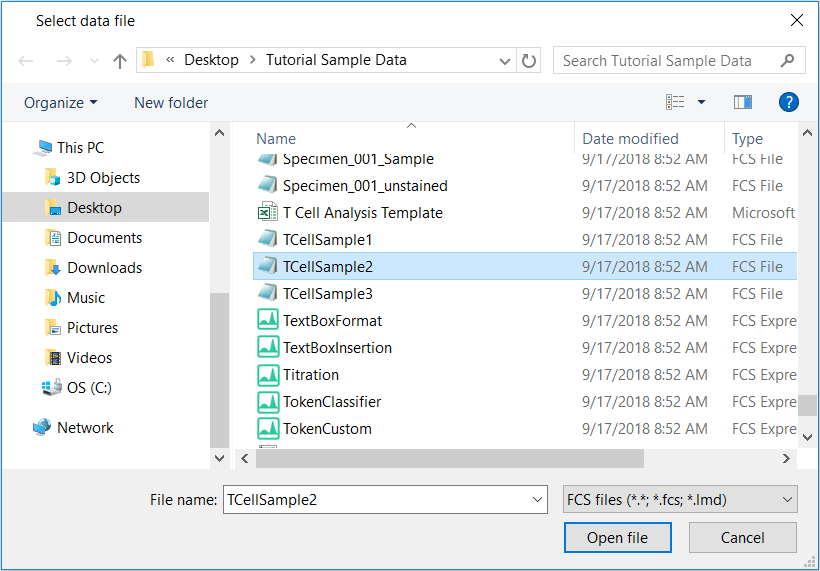
Figure T10.4 Select Data File Dialog
5.Navigate to the location where the tutorial sample data are saved and select the file: TCellSample2.fcs.
6.Click Open file.
The Data List window will show the two files, i.e. TCellSample1.fcs and TCellSample2.fcs.
Note: files are processed during a batch process in the order they appear in the Data List.
In this layout, we have defined gates to be used in the analysis of two files: TCellSample1.fcs and TCellSample2.fcs. The next step is to tell FCS Express what we want to create during the batch process for these two files.
7.Select the Batch & Export tab→Batch Export to PDF, PowrePoint, Excel, Prism, ... group→ Actions and Reports command  .
.
A Batch Actions and Reports window will appear (Figure T10.7). This is where you define which actions you want completed during the batch process.
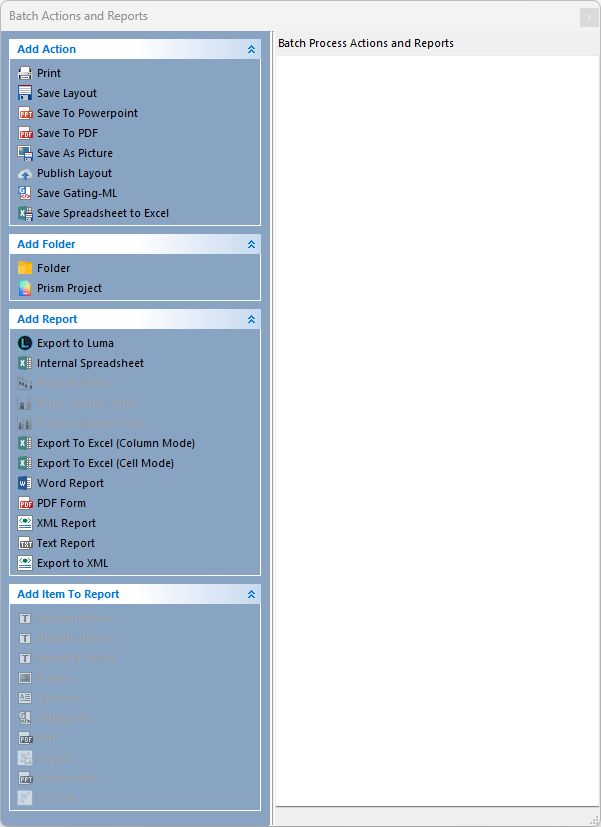
Figure T10.7 Batch Actions and Reports Dialog Window
We will now add Save To PowerPoint action, which will save a slide for each iteration during the batch process.
8.Click on the Add Action drop-down menu and select Save To PowerPoint, i.e. the third option of the drop-down menu in the figure above.
A Create Export To PowerPoint Action dialog will appear (Figure T10.9).
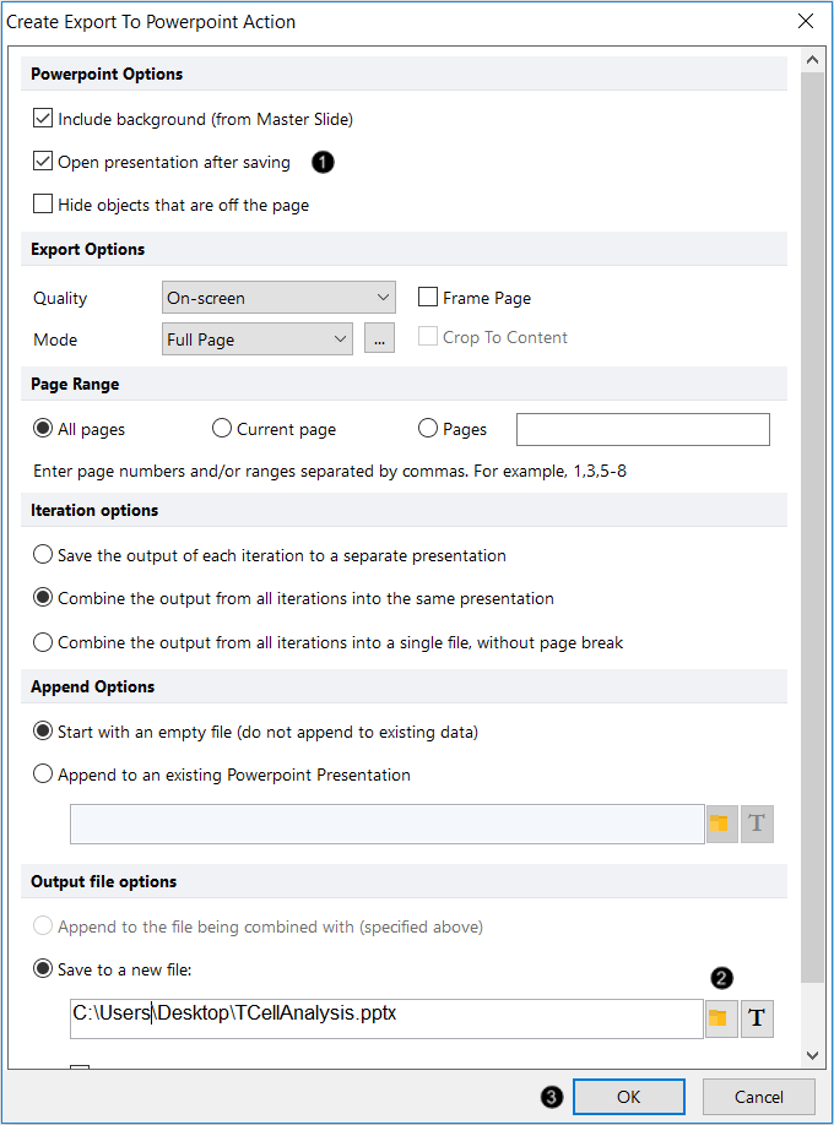
Figure T10.9 Create Export to PowerPoint Action Dialog
9.Check the box next to Open presentation after saving (Figure T10.9, ![]() ).
).
10. For Output file options, click the folder icon to choose where to save file and name it (Figure T10.9, ![]() ).
).
11. Click OK (Figure T10.9, ![]() ).
).
The Batch Actions and Reports window now lists the Export to PowerPoint action.
13. Select the Batch & Export tab→Batch Export to PDF, PowerPoint, Excel, Prism, ...→Run command ![]() .
.
FCS Express now will run the batch process. After a series of automated steps, PowerPoint will launch and open the TCellAnalysis.pptx. The file will consist of two slides: the first will be a slide showing the layout with the data file TcellSample1.fcs (Figure T10.12) and the second the layout with the data file TcellSample2.fcs (Figure T10.13).
Note about ungrouping objects in PowerPoint for PC versus PowerPoint for Mac
Once exported to PowerPoint, layout objects can be further ungrouped into single components in the PC version of Microsoft PowerPoint. Ungrouping objects saved by FCS Express in PowerPoint for Mac is not supported. However, presentations saved on a Mac may be opened on a PC and ungrouped.
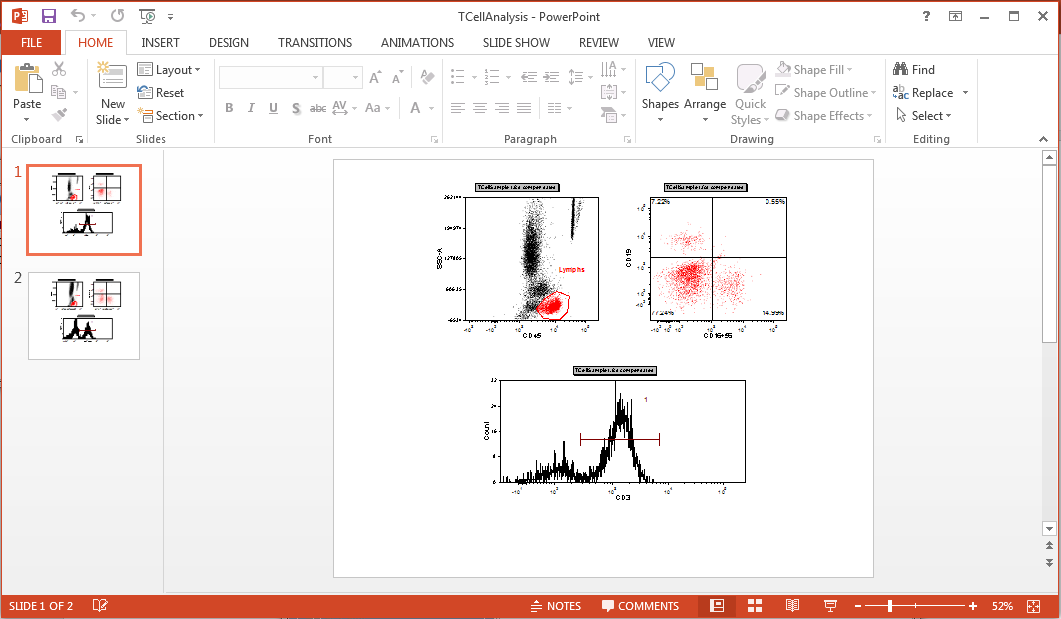
Figure T10.12 Slide 1 in PowerPoint
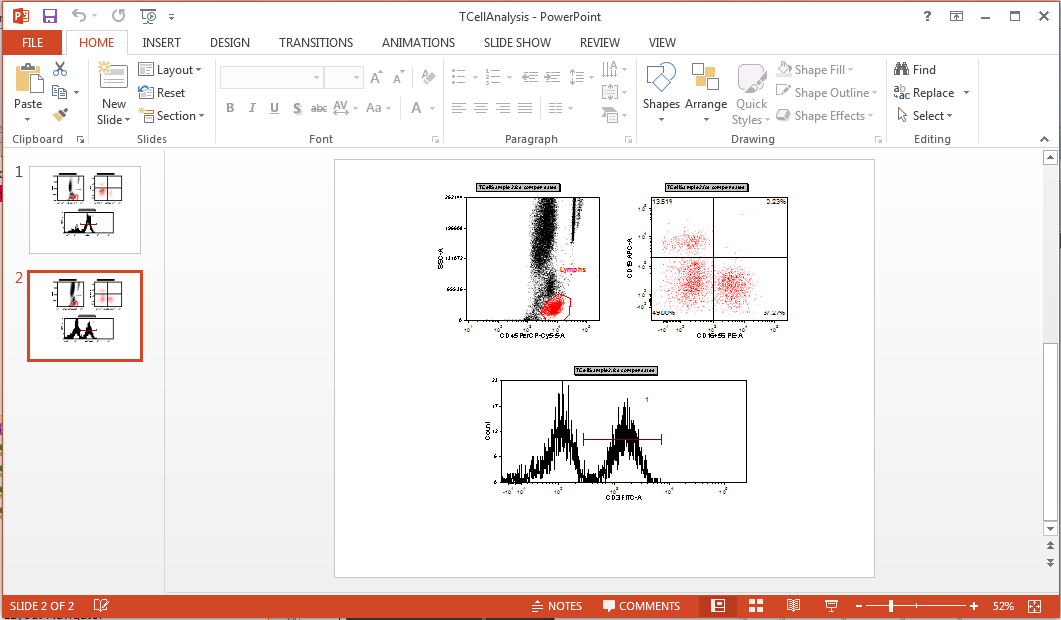
Figure T10.13 Slide 2 in PowerPoint
The next section will continue using this layout, so you can keep it open. Otherwise, please feel free to save it in order to resume at a later time.
In the next section, we will export to an Excel report (Cell Mode).
