Fluidigm 7 color (7C) kit demonstration
In the course of this example, we will:
•Learn how to Run an SOP
•Create plots
•Add gates and create gate hierarchies
•Add summary statistics
•Export a report to MS PowerPoint via batch processing.
To begin, we will open a saved layout that contains the SOP and pre-gated cleanup strategy.
1. Select File tab → Open.
2. Open the folder titled Fluidigm 7C SOP Demonstration located in the Tutorial Sample Data archive.
3. Select the 7C human kit analysis_SOP-template.fey file from the Load Layout dialog (Figure 36.2).
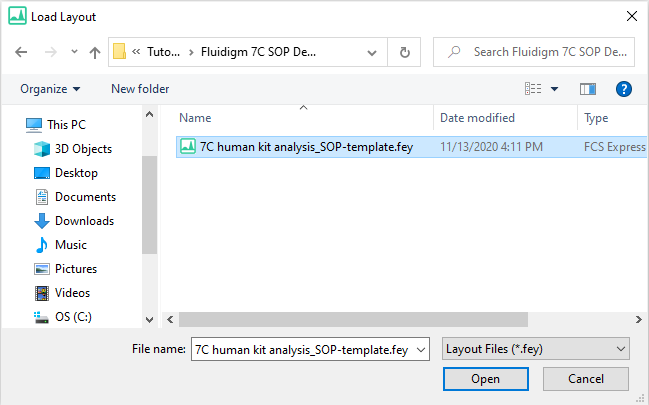
Figure 36.2 Load Layout Dialog
The layout will open to Page 1 as shown in Figure 36.3.
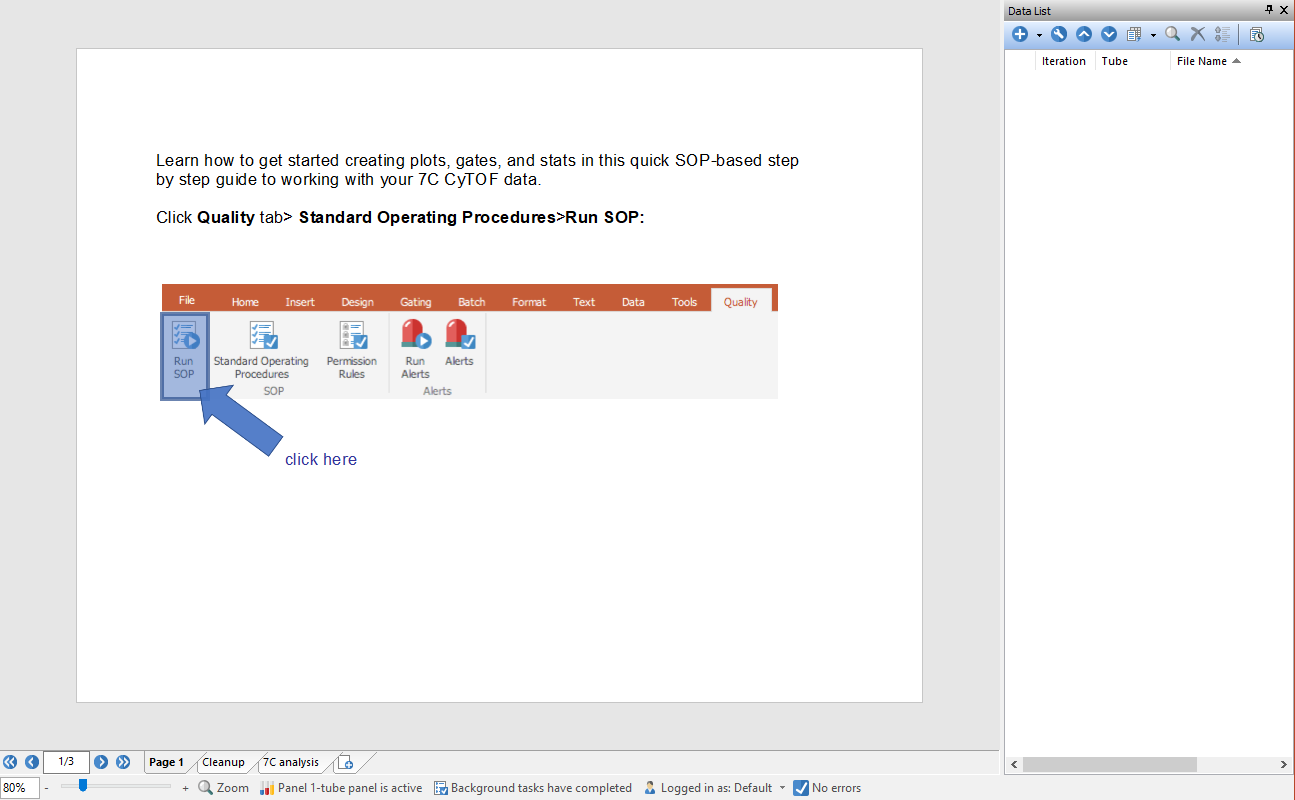
Figure 36.3 7C Human Kit Analysis SOP Template - Page 1
4.Click the Tools tab → SOP group → Run SOP command ![]() .
.
The SOP dialog will launch as in Figure 36.5 below.
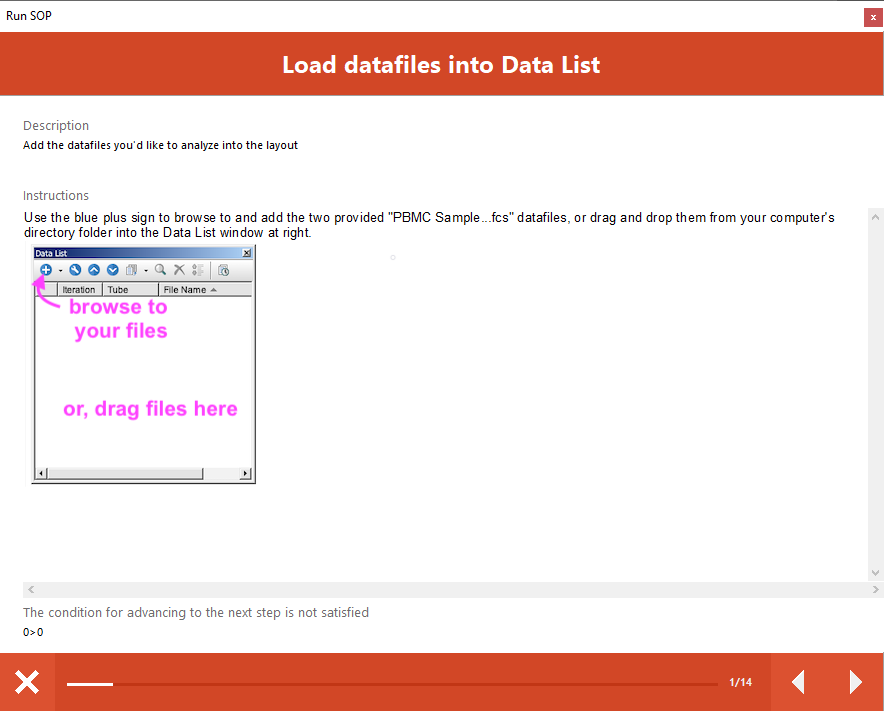
Figure 36.5 Run SOP window
Note that you may adjust the size and location of the Run SOP dialog. The Run SOP window is also a dockable window and can be docked to the sides of the software user interface (Figures 36.6).
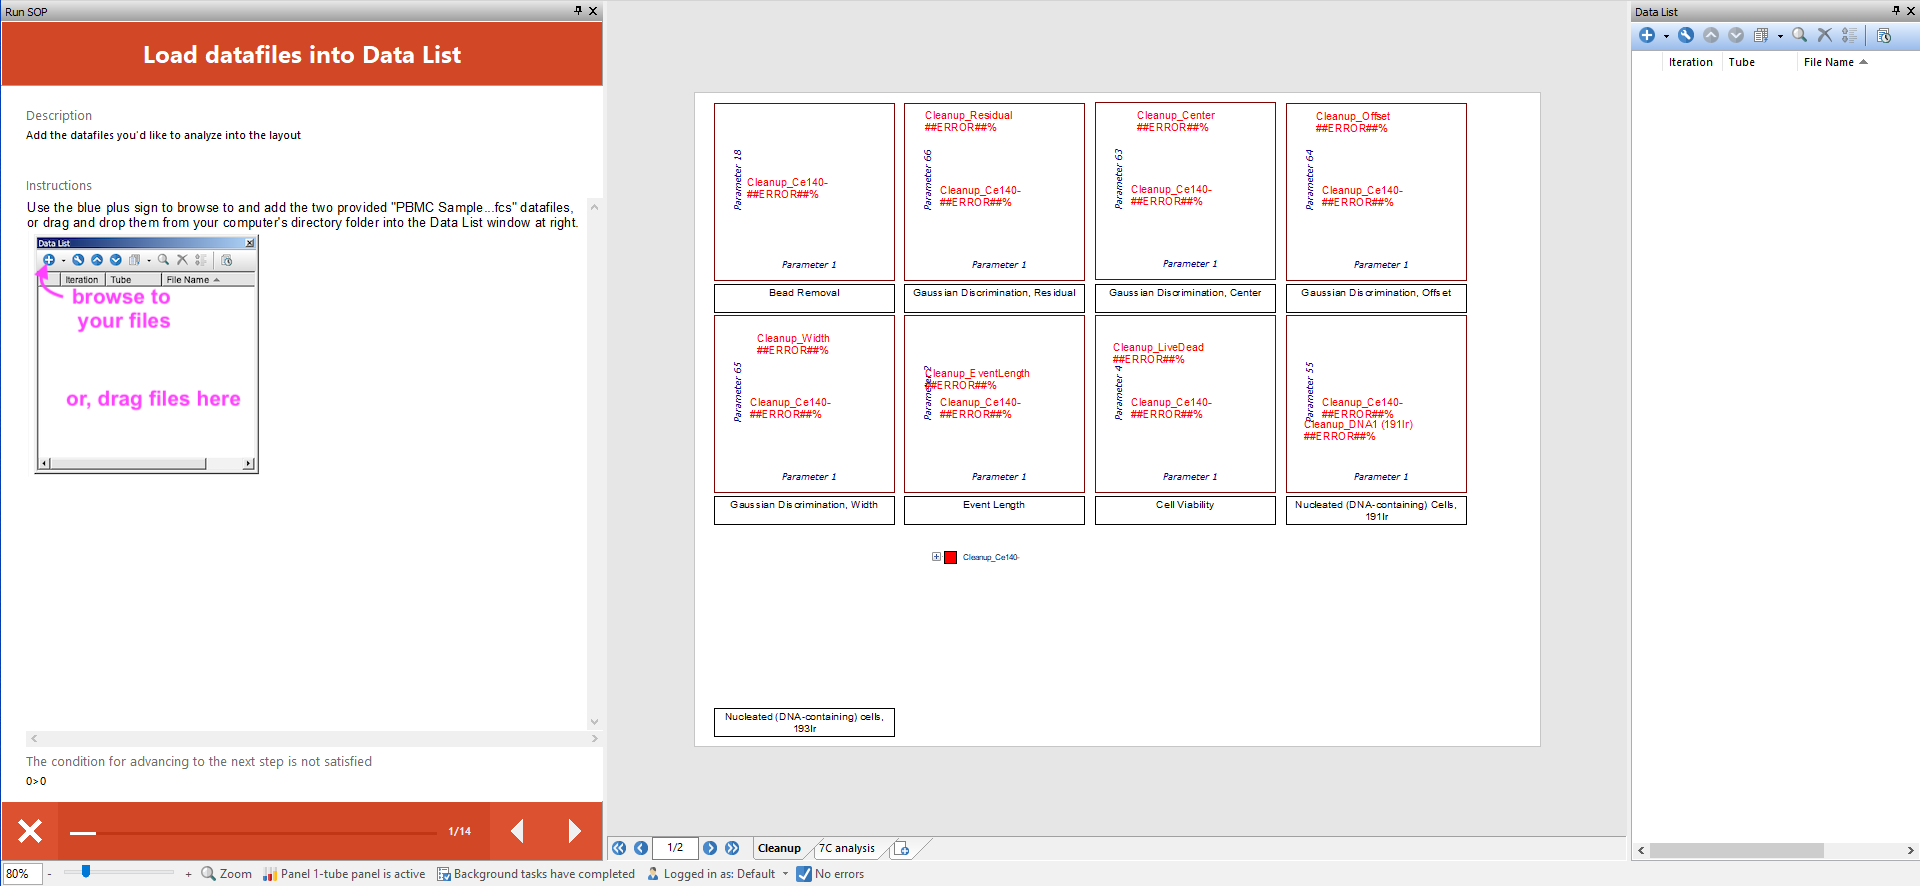
Figure 36.6 The Run SOP window has been docked to the right-side of the FCS Express User Interface
Read the Description for Step 1 presented in the Run SOP window. Follow the instructions provided to complete Step 1.
Note: You will not be able to continue to the next step in the SOP until the Step 1 instructions have been completed.
When the instructions for SOP Step 1 have been completed, the text at the bottom of the Run SOP window will indicate "The condition for advancing to the next step is satisfied" (Figure 36.7, green arrow).

Figure 36.7 The conditions for advancing to the next step have been satisfied
5. Click the forward arrowhead (Figure 36.7, blue arrow) to continue to the next step in the SOP.
The Cleanup page will now display data in all plots (Figure 36.8).
Note: Gate percentages in plot text boxes for all subsequent figures will vary, depending on your specific gate adjustments.
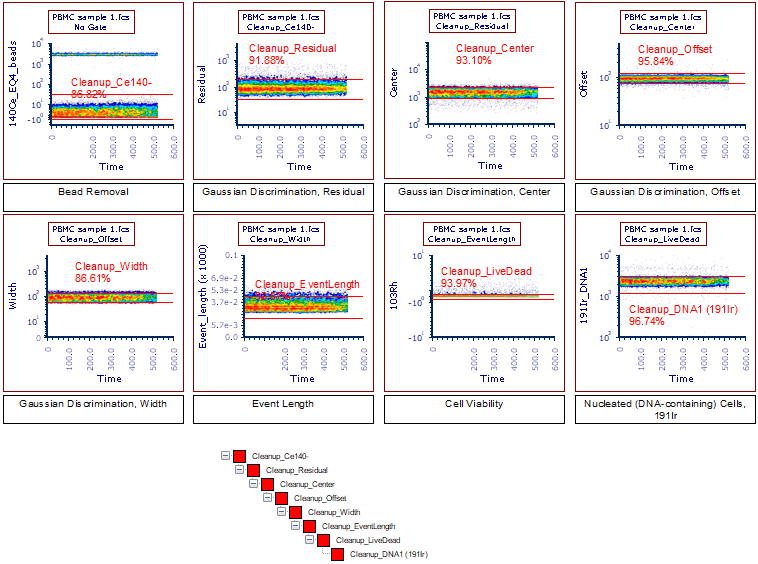
Figure 36.8 Successful completion of Step 1 in the Fluidigm 7C SOP Demonstration
6. Complete the remaining steps of the SOP.
When the SOP has been completed, the Cleanup page will appear as in Figure 36.9.
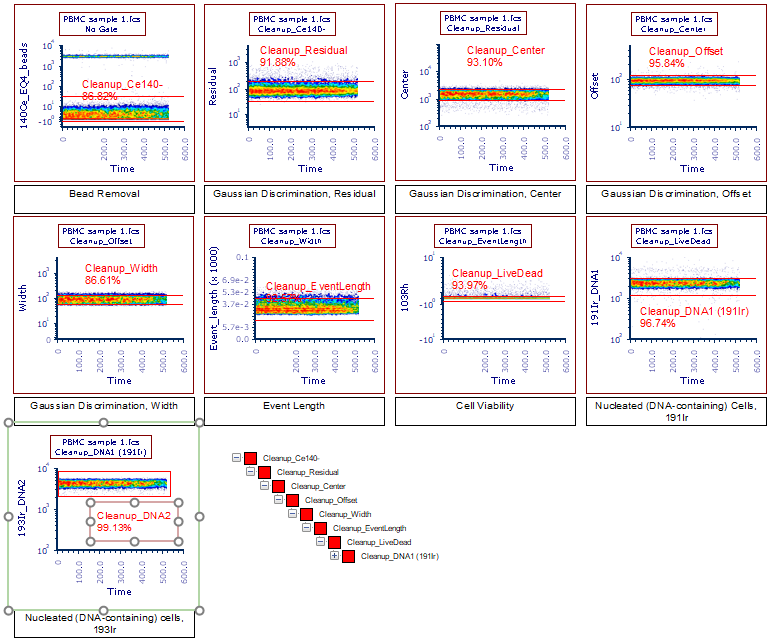
Figure 36.9 Successful completion of the Fluidigm 7C SOP Demonstration (Cleanup page)
The 7C analysis page will appear as in Figure 36.10.
Note: The 2D plots in Figure 36.12 have been formatted to move events off of the X and Y axis lines. To format your plots in this manner, right-click on the desired plot(s) and select Format this plot > Axes. Under Min/Max (Resolution) set the Minimum and/or Maximum to custom values for each Axis. This will set the plot to start and end at the desired value(s).

Figure 36.10 Successful completion of the Fluidigm 7C SOP Demonstration (7C analysis page)
The Batch Export to PowerPoint will appear as in Figure 36.11. Note there are PowerPoint slides for both the Cleanup and 7C analysis pages for each file in the Data List.
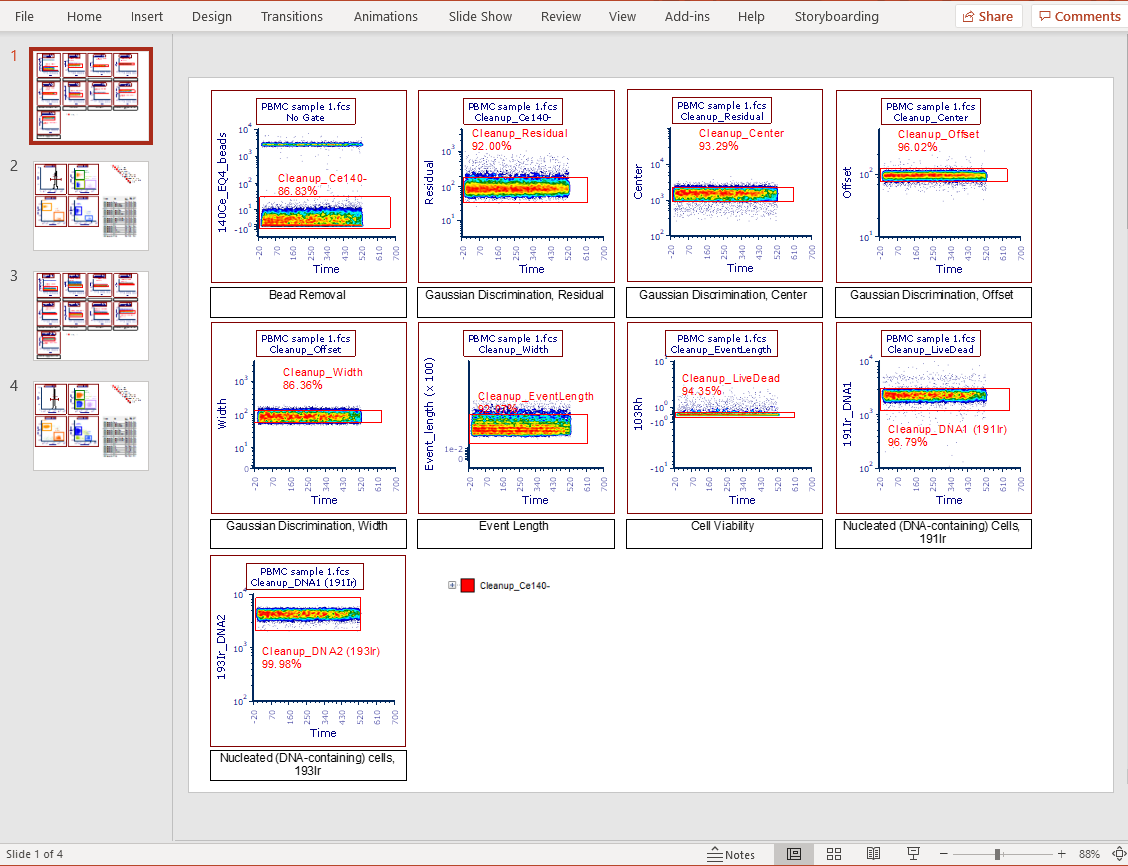
Figure 36.11 Successful completion of the Batch Export to PowerPoint
