Formatting Summary Charts
The Formatting Overlay dialog is common for all Summary Charts and allows users to define:
•Optional Group, Color, Split Violin and Split Violin Color parameters.
•Summary Shapes (e.g. Box, Violin, Beeswarm, Outliers,...) and Lines (e.g. Box border, Whisker, Mean, Median, Violin Border...) to display on the plot.
•Rules to define Outliers (when Outliers are visualized).
•Rules to define the Whisker extension (when Whiskers lines are visualized).
•Kernel Density Estimation (when the Violin shape is visualized).
To access the Formatting dialog for Summary Charts (Figure 5.267 below), either:
•Select the Summary Chart and use the Format tab→Plot Options→Overlays command, or
•Right-click on the Summary Chart, select Format from the pop-up menu, and choose the Overlays category.

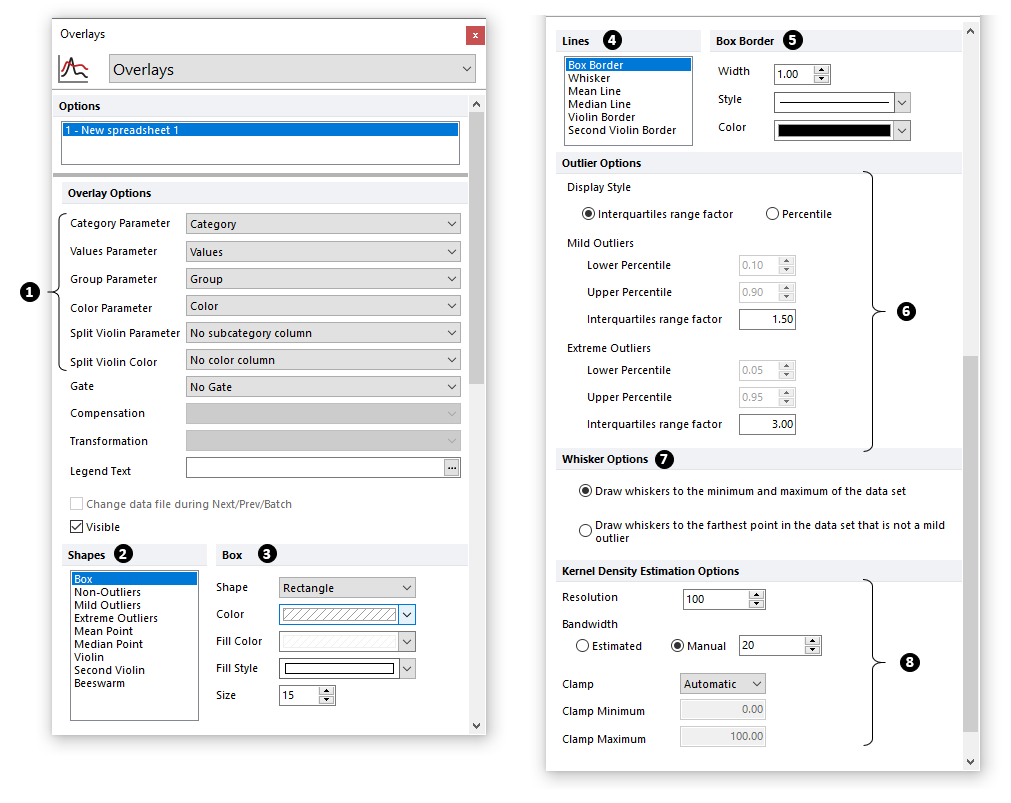
Fig. 5.265 Box and Whiskers Plot Overlays
Option |
Explanation |
|---|---|
(Category, Values, Group, Color, Split Violin and Split Violin Color Parameters)
|
The parameter (i.e., Spreadsheet column) intended for the each of the Category, Values, Group, Color, Split Violin and Split Violin Color Parameter is set using the appropriately named ... Parameter dropdown menus (
Category and Values parameters are mandatory for all Summary Charts. The other parameter are optional. The Split Violin and Split Violin Color parameters only apply when the Violin shape is visible (see Shapes section below).
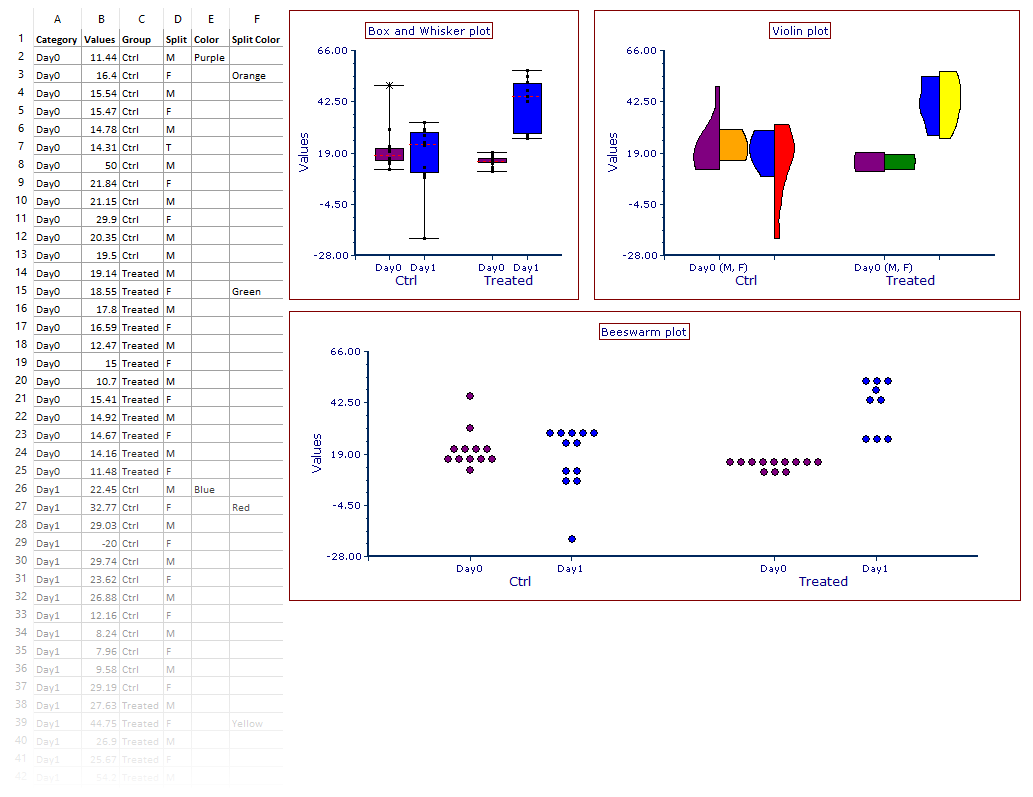
▪Category parameter: Is the primary classification label. This parameter is mandatory for all Summary Charts. ▪Values parameter: The numerical freetext or token value to be plotted for each row, where each row corresponds to a data point. ▪Group parameter: A second level of classification. When a Group parameter is defined, the data within each Category is graphed separately accordingly to the group classification. In the examples below (Figure 5.268), the Group parameter contains two classifications: "Ctrl" and "Treated". ▪Color parameter: The column of the spreadsheet containing the colors that should be used for each Category. When the Color parameter is specified, the "Color Parameter" will be an available option in the color drop-down menu for the element of interest (e.g. the Box, the Violin or the Beeswarm) in the Shapes section (see below). The number of color levels specified in the spreadsheet column for this parameter, must match the number of categories. ▪Split Violin Parameter: A third level of classification. When the Split Violin parameter is selected, and both the Violin and the Second Violin shapes are visible (see the Shapes section below), each violin will be split in two halves based on the parameter values. The split parameter must contain no more than two different classification labels. In the examples below, the Split Violin parameter contains two classifications: "M" and "F". ▪Split Violin Color: The column of the spreadsheet containing the colors that should be used for each second-half of each violin. When the Split Violin Color parameter is specified, the "Color Parameter" will be an available option in the color drop-down menu of the Shapes→Second Violin section (see below). The maximum number of color levels that can be specified in the spreadsheet column for the Split Violin Color parameter is equal to the number of categories multiplied by the number of groups.
|
|
The Shapes list allows to select which element of plot shapes to format:
▪Box: The box which outlines the middle two quartiles and is optionally bisected by the Mean or Median Line. Box is visible by default when a Box and Whisker plot is created, and hidden otherwise. ▪Non-Outliers: Data points which are not outliers according to Outlier Options. Visible by default when a Box and Whisker plot is created, and hidden otherwise. ▪Mild Outliers: Data points which are mild outliers according to Outlier Options. Visible by default when a Box and Whisker plot is created, and hidden otherwise. ▪Extreme Outliers: Data points which are extreme outliers according to Outlier Options. Visible by default when a Box and Whisker plot is created, and hidden otherwise. ▪Mean Point: The statistical mean of the dataset. Hidden by default on all summary charts. ▪Median Point: The statistical median of the dataset. Hidden by default on all summary charts. ▪Violin: The primary violin. Visible by default when a Violin plot is created, and hidden otherwise. ▪Second Violin: The secondary violin plot (only available if a Split Violin Parameter is defined; see above). Hidden by default for both Box and Whisker and Beeswarm plots. ▪Beeswarm: Allows users to display each single data point as a Beeswarm plot. Visible by default when a Beeswarm plot is created, and hidden otherwise.
Formatting options for the selected element will be displayed at the right (Figure 5 above
▪Shape ▪Color ▪Fill Color (not available for Violin and Second Violin shapes) ▪Fill Style (not available for Violin and Second Violin shapes) ▪Size (or Scale, for both Violin and Second Violin shapes)
If a Color Parameter has been selected in the Overlay Options (see above) the color for the selected shape may be set to "Color Parameter". If a Split Violin Color Parameter has been selected in the Overlay Options (see above) the color for the Second Violin may be set to "Color Parameter".
|
|
The Lines list allows to select which lines to format:
▪Box Border ▪Whisker ▪Mean Line ▪Median Line ▪Violin Border ▪Second Violin Border
The lines above are visible and formattable only when they corresponding shape is visible. E.g. the Second Violin Border only applies if the Second Violin shape is made visible in the Shape section (See above).
Formatting options for the selected element will be displayed at the right (Figure 5 above
If a Color Parameter has been selected in the Overlay Options (see above) the color for the selected line can be set to "Color Parameter". If a Split Violin Color Parameter has been selected in the Overlay Options (see above) the color for the Second Violin Border can be set to "Color Parameter".
|
|
In Outlier Options, the Lower and Upper Percentiles and Interquartiles range factor are set in order to define the Mild and Extreme Outliers which may be plotted according to the Shapes settings (
Outliers are visible by default when a Box and Whisker plot is created, and hidden otherwise.
|
|
In Whisker Options, whiskers may be either set to either: ▪Draw whiskers to the minimum and maximum of the data set, or ▪Draw whiskers to the farthest point in the data set that is not a mild outlier according to Outlier Options (Figure 5 above Whiskers are visible by default when a Box and Whisker plot is created, and hidden otherwise.
|
|
The Kernel Density Estimation is used to draw the Violin shape and may be customized by changing Resolution, Bandwidth method and value, Clamp method and Minimum/Maximum values.
The Violin shape is visible by default when a Violin plot is created, and hidden otherwise.
|

Fig. 5.266. Example of Box and Whisker, Violin plots and Beeswarm charts.
