Layout Navigator Features
The Layout Navigator is organized by the Pages of the layout. Notice the current page, Page 1, is highlighted in yellow (Figure T13.6). Under the Page, all the plots on that page are listed. Under each plot, the file name, gating, and other information are listed. A very powerful feature of the Layout Navigator is the ability to drag and drop plots, gates, or data within the Layout Navigator or directly onto the layout. We now will explore the many features of the Layout Navigator.
1.Hover the mouse over the Page 2 listing on the Layout Navigator (Figure T13.6, red arrow).
A thumbnail image of the actual layout page will appear (Figure T13.6, red outline). This is a helpful, quick reminder of the layout of plots on a page that may be visible presently. This feature also applies to the plot listings in the Layout Navigator. If you hover the mouse over any of the plot listings in the Layout Navigator, a thumbnail of the respective plot will appear.
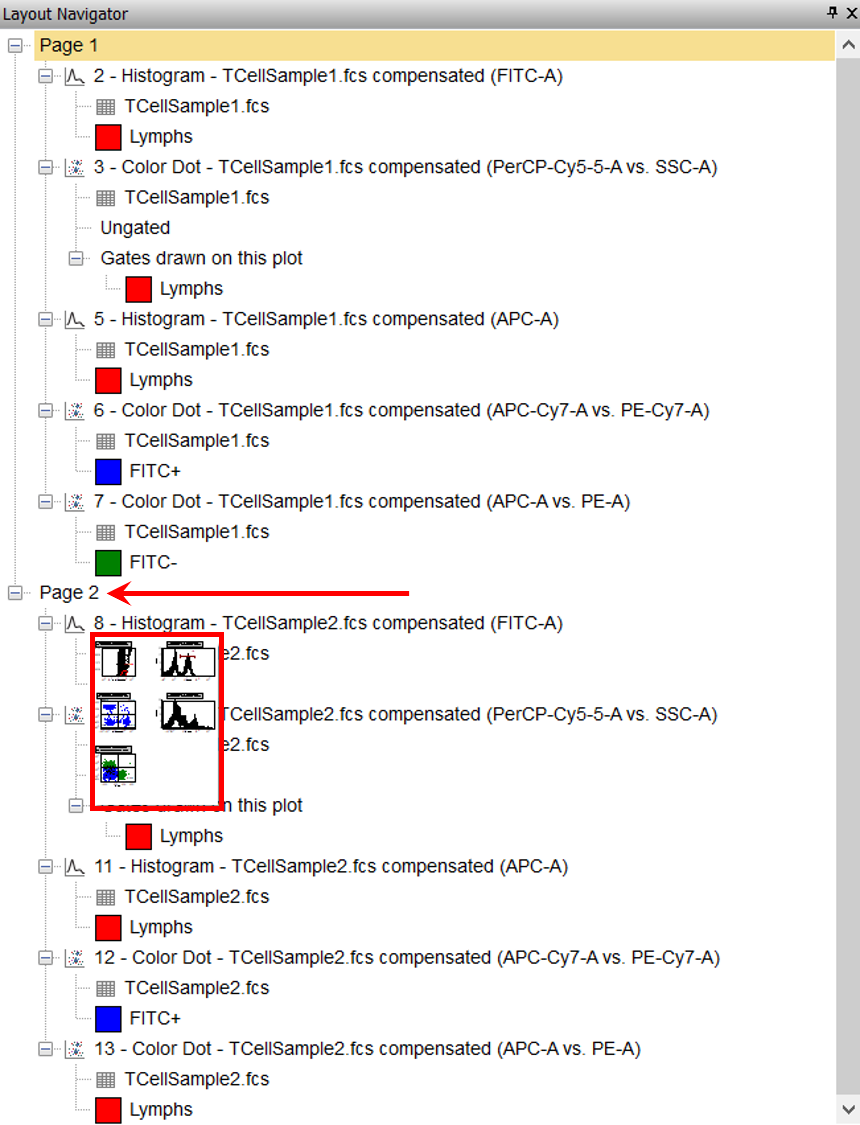
Figure T13.6 Image of Page 2 on the Layout Navigator
2.Click on Page 2 in the Layout Navigator.
Page 2 of the layout now appears with five plots (Figure T13.7). This demonstrates another way of changing pages within the layout. This page is identical to its thumbnail from step 1 shown in Figure T13.6. Also notice Page 2 is now highlighted in yellow within the Layout Navigator, indicating it is displayed currently.
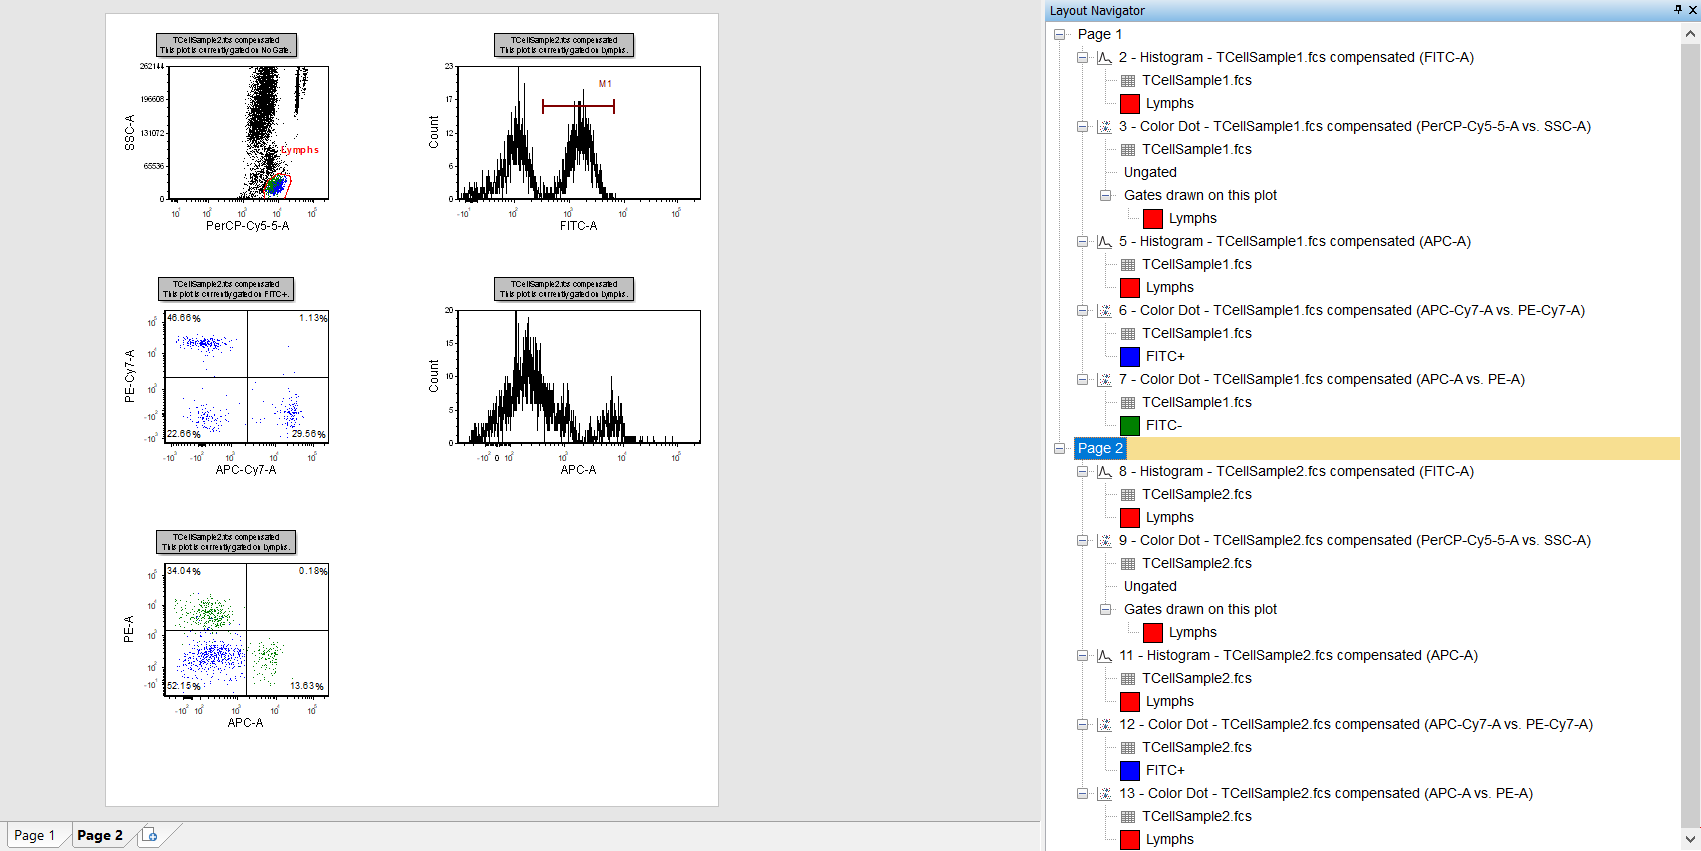
Figure T13.7 Page 2 of the Layout Displayed
3.Select the TCellSample2.fcs APC-A vs PE-A color dot plot in the lower left of the layout (Figure T13.8). Notice that the listing for the 13 - Color Dot - TCellSample2.fcs compensated (APC-A vs PE-A) is now highlighted in the Layout Navigator, as shown in Figure T13.8.
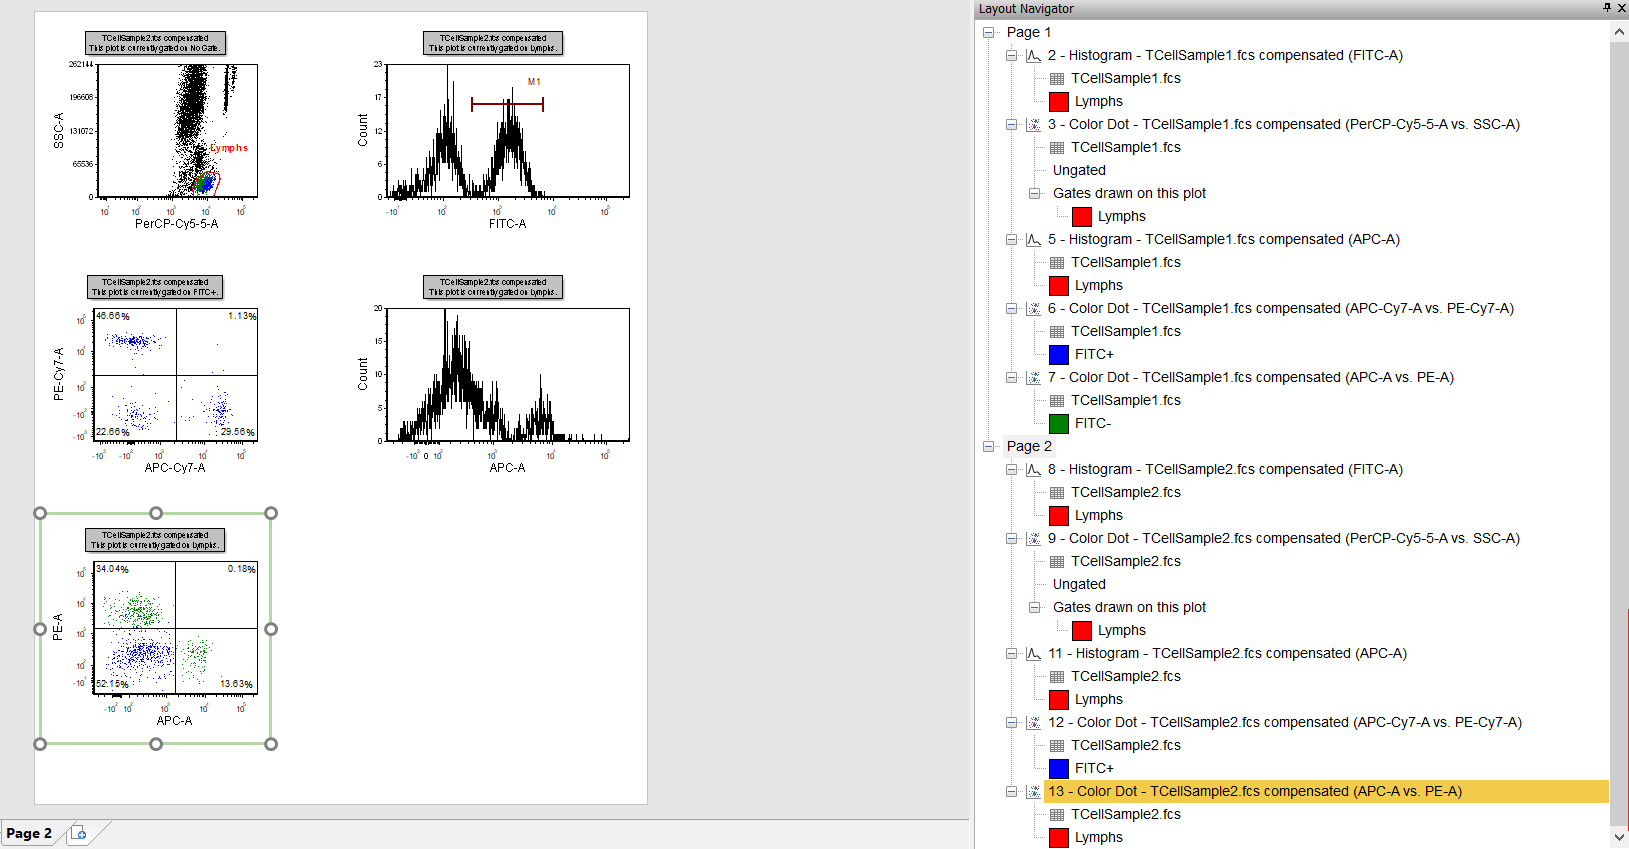
Figure T13.8 TCellSample2.fcs Color Dot Plot Selected
This plot is currently gated using the Lymphs gate. We will now use the Layout Navigator to apply the FITC- gate to 13 - Color Dot - TCellSample2.fcs compensated (APC-A vs PE-A).
4.Place the cursor over the FITC- gate under 7 - Color Dot - TCellSample1.fcs compensated (APC-A vs PE-A) on Page 1 of the Layout Navigator.
5.Click the left mouse button and drag FITC- gate to 13 - Color Dot - TCellSample2.fcs compensated (APC-A vs PE-A), on Page 2 of the Layout Navigator.
6.Release the mouse button when the cursor is over the 13 - Color Dot - TCellSample2.fcs compensated (APC-A vs PE-A) (Figure 13.9, red arrow).
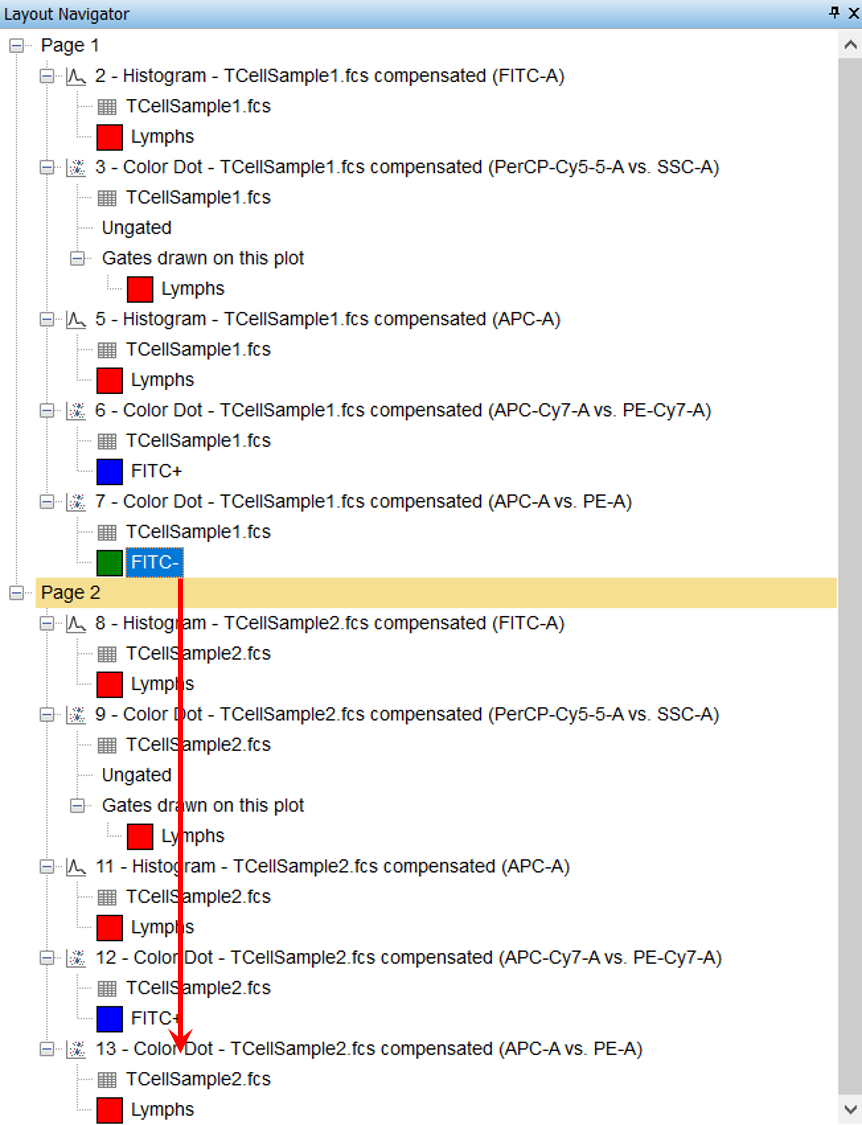
Figure T13.9 Dragging and Dropping FITC- Gate from Plot 7 on Page 1 to Plot 13 on Page 2 in Layout Navigator
7.Click Undo ![]() in upper left of window to remove the FITC- gate. You may use the keyboard shortcut CTRL+Z to undo as well.
in upper left of window to remove the FITC- gate. You may use the keyboard shortcut CTRL+Z to undo as well.
Alternatively, you can directly drag the gate from the Layout Navigator onto the plot on the layout.
A. Click on Page 2 in the Layout Navigator to display that layout page.
B. Place the cursor over the FITC- gate, listed under 7 - Color Dot - TCellSample1.fcs compensated (APC-A vs PE-A) on Page 1 of the Layout Navigator, highlighted in blue in Figure T14.10.
C. Click and hold the left mouse button.
D. While holding the mouse button, drag the FITC- gate onto the plot 13 - Color Dot - TCellSample2.fcs compensated (APC-A vs PE-A) that is visible on Page 2.
E. Release the mouse button when the FITC- gate is on the plot 13 - Color Dot - TCellSample2.fcs compensated (APC-A vs PE-A).
13 - Color Dot - TCellSample2.fcs compensated (APC-A vs PE-A) updates to reflect the application of the FITC- (FigreT13.10). The Layout Navigator also updates to reflect the FITC- gate on the 13 - Color Dot - TCellSample2.fcs compensated (APC-A vs PE-A).
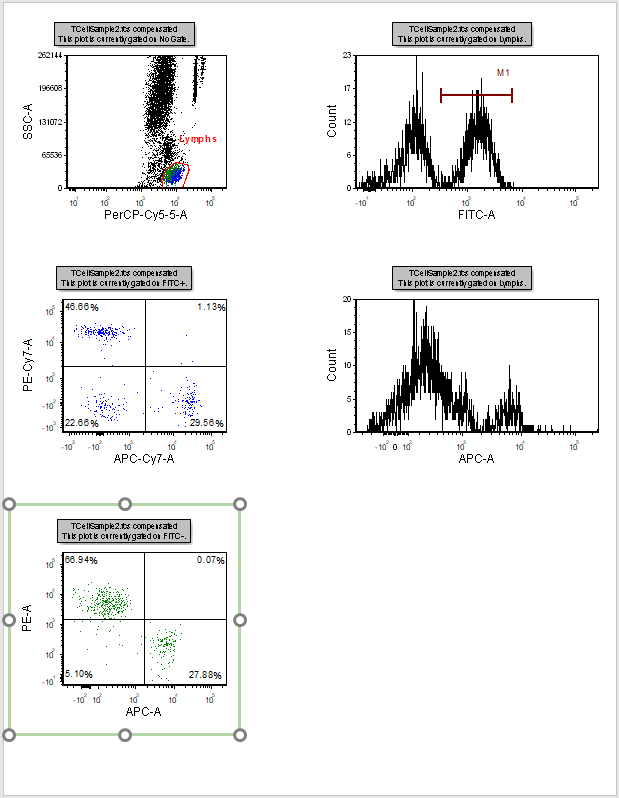
Figure T13.10 Plot 13 on Page 2 Updated with FITC- Gate from Plot 7 on Page 1
We have illustrated two ways you can apply a gate to a plot using the Layout Navigator. Now, we will use the Layout Navigator to add an overlay to a histogram.
9. Click on Page 2 in the Layout Navigator to display that layout page if necessary.
10. Place the cursor over the listing for the TCellSample1.fcs data from any plot on Page 1.

Figure T13.11 Dragging and Dropping TCellSample1.fcs Data File from Layout Navigator to FITC-A Histogram
11. Press and hold the left mouse button.
12. Continue to hold down the mouse button and drag the TCellSample1.fcs data onto the layout to the histogram TCellSample2.fcs compensated (FITC-A) on Page 2 until blue outline appears around plot (Figure T13.11, red arrow).
13. In Select Drag and Drop Action window, choose add the files to the plot as new overlays and click OK (Figure T13.12).
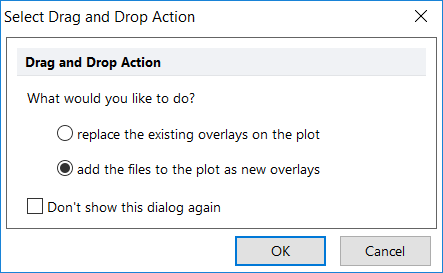
Figure T13.12 Selecting to Add File as New Overlay for Drag and Drop from Data List to Histogram
14. Histogram will resemble Figure 13.13.
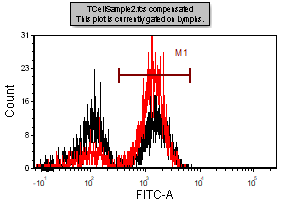
Figure T13.13 Histogram After Adding New Overlay TCellSample1.fcs Data File
Alternatively, you can drag and drop the data within the Layout Navigator.
A.Press Undo ![]() to remove overlay added from steps 9-14 above.
to remove overlay added from steps 9-14 above.
B.Place the cursor over any listing for the TCellSample1.fcs data on Page 1 in the Layout Navigator.
C.Click and hold the left mouse button.
D.While holding the mouse button, drag the TCellSample1.fcs data file in the Navigator Layout to plot 8 - Histogram - TCellSample2.fcs compensated (FITC-A).
E.Release the mouse button when the cursor is over 8 - Histogram - TCellSample2.fcs compensated (FITC-A) (Figure T13.14, red arrow).
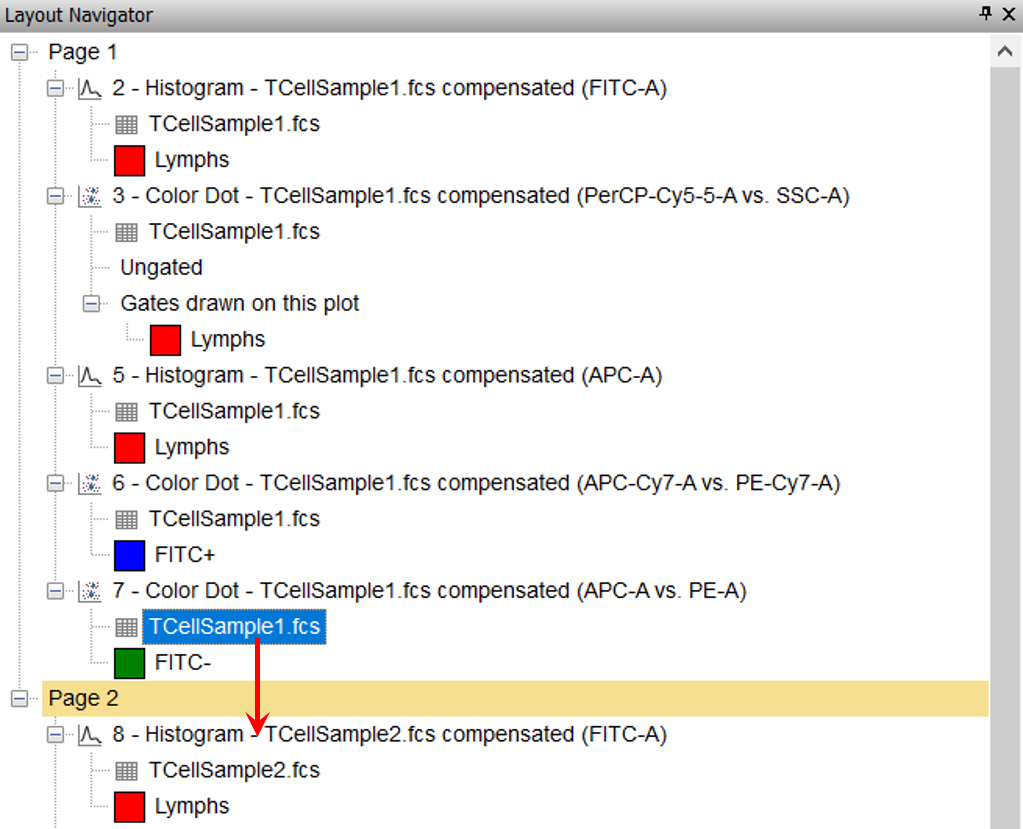
Figure T13.14 Dragging and Dropping TCellSample1.fcs Data File within the Layout Navigator
The Select Drag and Drop Action dialog appears (Figure T13.12).
14. Select add the files to the plot as new overlays.
15. Click OK.
The 8 - Histogram - TCellSample2.fcs compensated (FITC-A) plot now updates to reflect the overlay of the TCellSample1.fcs data as shown in Figure T13.13. The Layout Navigator also updates to show that there is now overlay data on 8 - Histogram - TCellSample2.fcs compensated (FITC-A) (Figure T13.15).
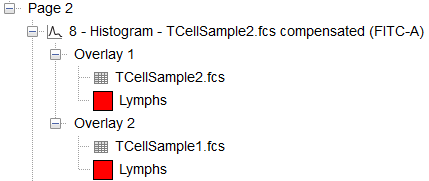
Figure T13.15 Layout Navigator Showing Two Overlays for Plot 8 on Page 2
16. Click on the Undo icon ![]() on the Quick Access Toolbar.
on the Quick Access Toolbar.
The 8 - Histogram - TCellSample2.fcs compensated (FITC-A) updates to reflect the removal of the overlay.
We will now use the Layout Navigator to insert a new plot onto page 2 of the layout (Figure T13.16).
17. Click on Page 2 in the Layout Navigator if page 2 is not already being displayed.
18. Place the cursor over any listing for the TCellSample2.fcs data in the Layout Navigator.
19. Drag and drop TCellSample2.fcs data onto blank, white space of Page 2 in the layout (Figure T13.16, red arrow).
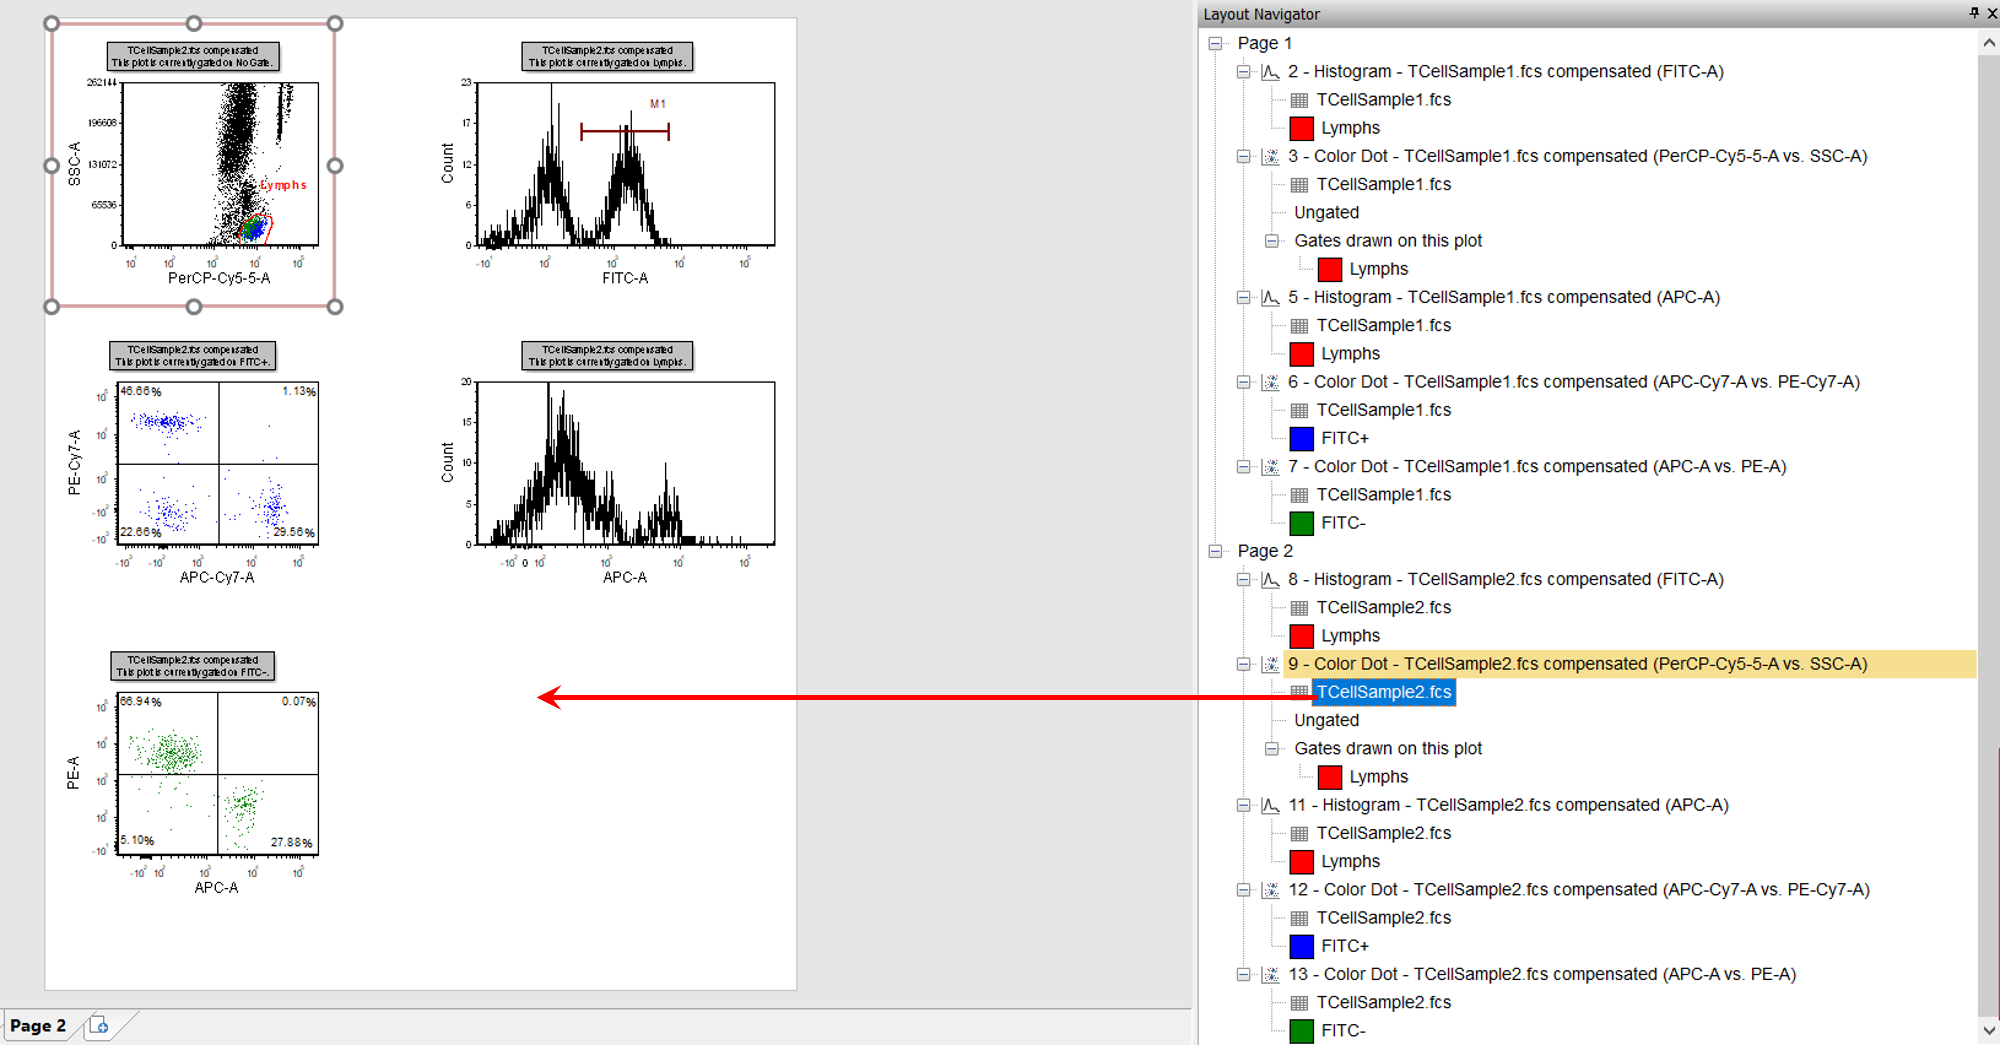
Figure T14.16 Dragging and Dropping TCellSample2.fcs onto the Layout
The Select Plot Types… dialog appears (Figure T14.17).
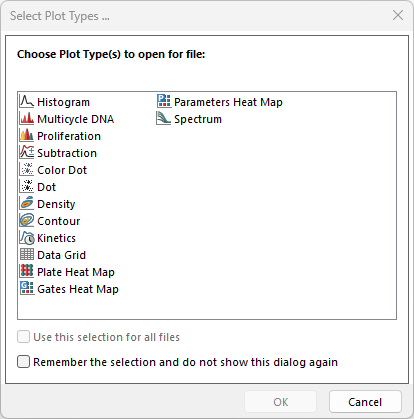
Figure T14.17 Select Plot Types... Dialog
22. Select Density only.
23. Click OK.
A density plot of the TCellSample2.fcs data now appears on the layout, with Time vs FSC-H as the default parameters. The Layout Navigator also updates to reflect the insertion of the 2D plot on page 2 of the layout (Figure T14.18).

Figure T14.18 Density plot of TCellSample2.fcs with Updated Layout Navigator
We now will undo the insertion of the 2D plot.
24. Click the Undo icon ![]() in the Quick Access Toolbar.
in the Quick Access Toolbar.
We now will use the Layout Navigator to move a plot from one page to another.
25. Place the cursor over the listing for 7 - Color Dot - TCellSample1.fcs compensated (APC-A vs PE-A) (Figure T14.19).
26. Press and hold the left mouse button.
27. Continue to hold down the mouse button and drag the 2D plot down the Layout Navigator.
28. Release the mouse button when the cursor is over Page 2 on the Layout Navigator (Figure T14.19, red arrow).
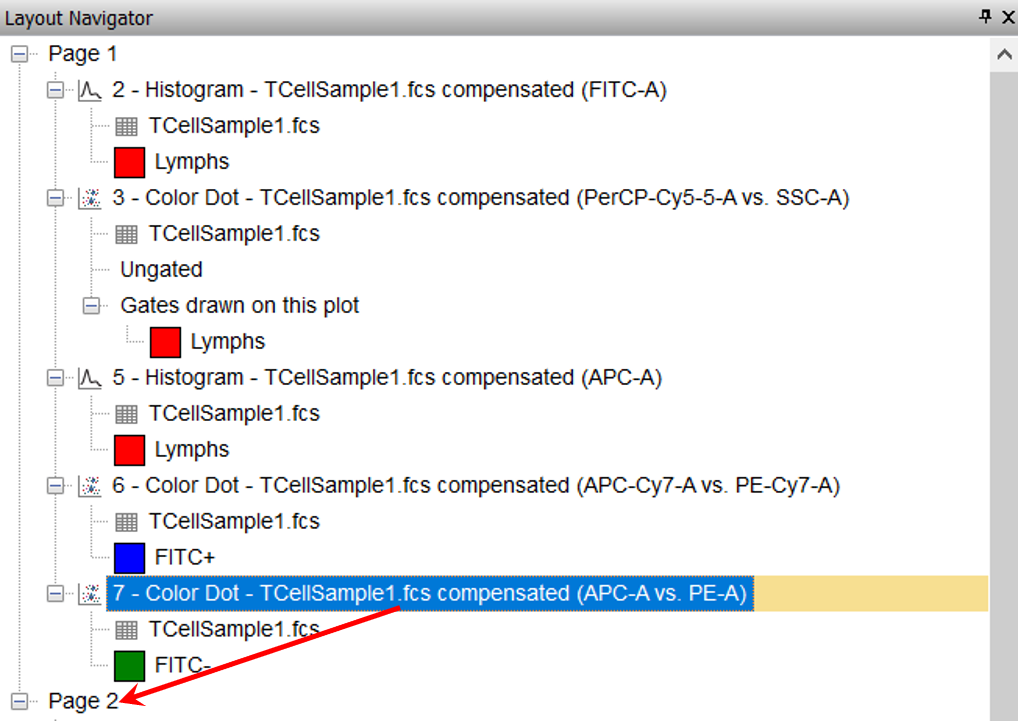
Figure T14.19 Moving a Plot from Page 1 to Page 2 in the Layout Navigator
Both the layout and the Layout Navigator update to reflect the new location of the color dot plot.
29. Click on Page 1 in the Layout Navigator (Figure T14.20, yellow highlighted text).
Page 1 of the layout appears (Figure T14.20). Notice 7 - Color Dot - TCellSample1.fcs compensated (APC-A vs PE-A) is no longer in the lower left of the page 1 since it was moved to its same location on page 2 of the layout.
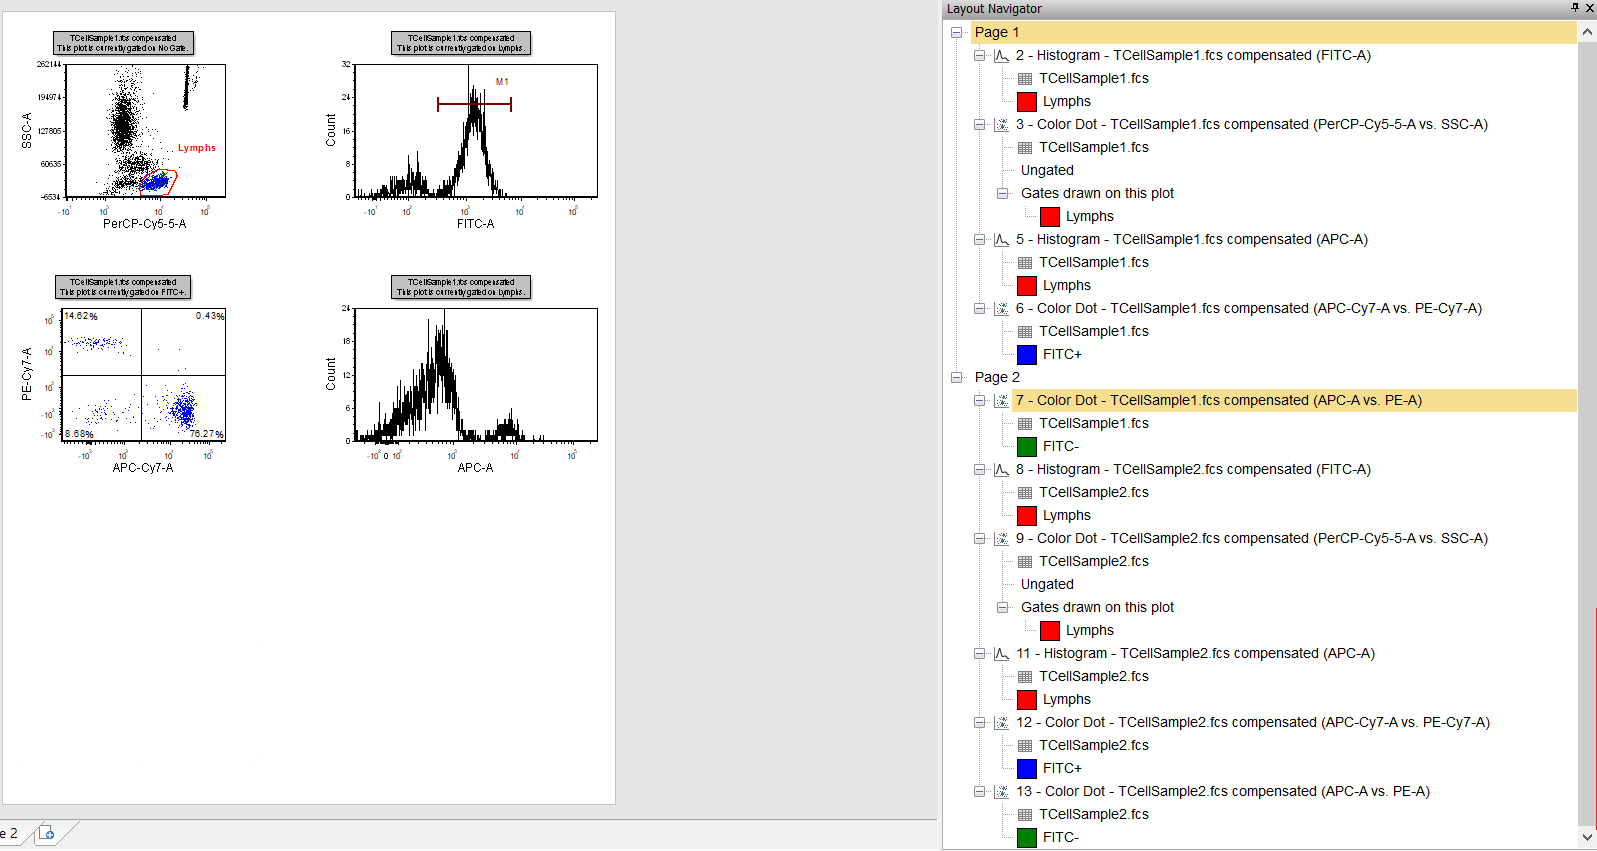
Figure T14.20 Page 1 of the Layout without the Plot 7
30. Click on Page 2 in the Layout Navigator.
Page 2 of the layout appears (Figure T14.21). Notice that 7 - Color Dot - TCellSample1.fcs compensated (APC-A vs PE-A) is now added to the bottom left corner of the layout (in selected mode), and the Layout Navigator now reflects the addition of this plot to page 2. You can move the new plot to an open part of the layout.
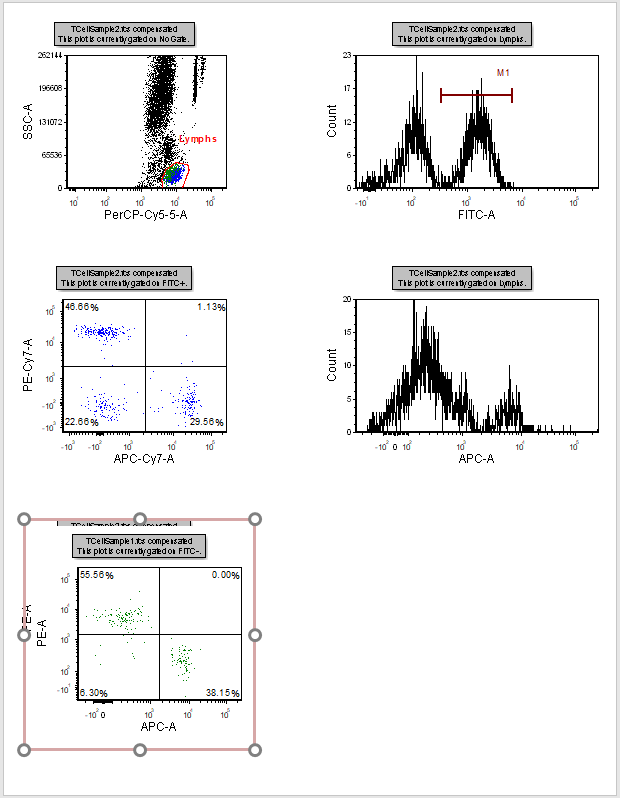
Figure T14.21 Page 2 of the Layout with the Addition of the new 2D Color Dot Plot
Alternatively, the 2D plot could have been moved by dragging and dropping the plot listing in the Layout Navigator directly onto page 2 of the layout.
All of the previous manipulations of data, gates, and plots with the Layout Navigator involved dragging and dropping the items. However, another way to accomplish these actions would have been to use the pop-up menu associated with the different items in the Layout Navigator. Just like all the other pop-up menus, the Layout Navigator pop-up menus are accessed by right-clicking when the cursor is located over an item in the Layout Navigator. We will now use the Layout Navigator to move the 2D plot from page 2 back to page 1 of the layout.
31. Select 7 - Color Dot - TCellSample1.fcs compensated (APC-A vs PE-A) on Page 2 of the Layout Navigator.
32. Right-click red border of the color plot on Page 2 of the layout to bring up the submenu.
33. Select Cut from the submenu (Figure T14.22, blue highlighted text).
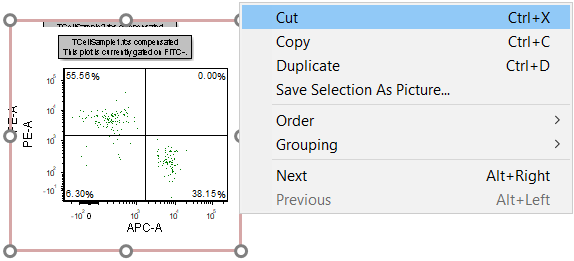
Figure T14.22 Layout Navigator 2D Plot Pop-up Menu
The color dot plot is cut from page 2 of the layout.
34. Right-click Page 1 on the Layout Navigator to bring up the Layout Navigator pop up menu.
35. Select Paste from the menu (Figure T14.23, blue highlighted text).
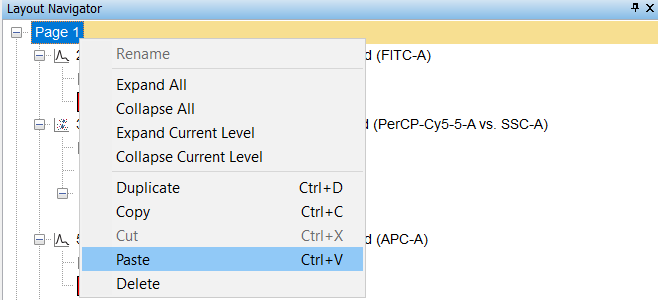
Figure T14.23 Paste 2D Plot Menu Item
Alternatively, after following steps 31 through 33 to cut the color dot plot, you can place the cursor directly onto page 1 of the layout, right-click to bring up the pop-up menu and select Paste to paste the color dot plot. You also may use keyboard shortcuts to cut and paste the plot from page 2 to page 1.
The color dot plot is now pasted back onto page 1 of the layout and the Layout Navigator updates to reflect this change.
