Manual Compensation
To adjust the compensation manually:
1.Select File tab→Open.
2.Open the layout ManualComp.fey found in the Tutorial Sample Data archive.
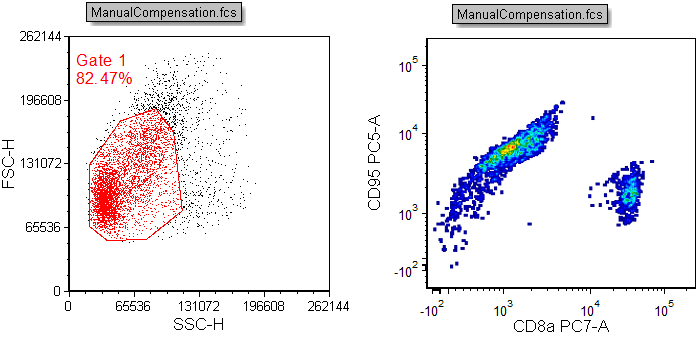
This layout contains two plots. The dot plot of FSC-H vs. SSC-H is showing a gate based on size (Gate 1). The right plot of CD95 PC5-A vs. CD8a PC7-A is gated on Gate 1 (Figure T8.1).

Figure T8.1 Uncompensated Plots
3.Click on the Tools tab→Transformations group→Compensation and Unmixing command to open the Compensation and Unmixing navigator.
4.Click on the blue plus button, ![]() , to Add a new compensation.
, to Add a new compensation.
5.Drag and drop (by click and holding the left mouse button) the New Compensation on top of the ManualCompensation.fcs plot in the upper right of the layout
6.Right-click on the right density plot of CD95 PC5-A vs. CD8a-PC7-A to bring up the associated pop up menu.
7.Select Show Compensation Adjustment Sliders→ New Compensation from the pop up menu.
8.Two green sliders will appear on the right and top edge of the plot and one Edit Compensation dialog will appear close to the plot, showing parameter pairs and the current compensation values
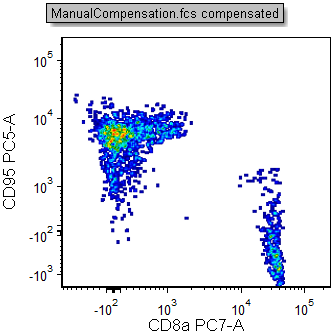
9.Adjust the sliders shown until the 2D plot looks like Figure T8.5.
Be careful not to overcompensate! Proper compensation will require around 6.0% of CD95 PC5-A - % of CD8a PC7-A and 18.0% of CD8a PC7-A - % of CD95 PC5-A.
9.Right-click again on the plot and select Hide Compensation Adjustment Sliders→ New Compensation from the pop up menu.

Figure T8.5 Manual Compensation using Edit Compensation Sliders
Manual compensation of the file is now complete.
Note: Sometimes when working with your own data digitization errors may occur (i.e. picket-fencing). If you wish to correct for the digitization errors, please see the brief Compensation Digitization Errors tutorial.
Note: Existing compensations may also be adjusted via the Compensation Window. Please see the Manually Editing a Compensation Matrix via the Compensation Window section of the manual for more details.
In the next section, we will use Automatic Compensation.
