Multi Plot
The Multi Plot feature in FCS Express allows a user to insert multiple plots to display combinations of parameters and compensations with a single click. The resulting plots are grouped together allowing them to be re-sized and formatted individually or as a group. The plots may also be ungrouped at any time.
To use the Multi Plot tools you will need to first insert a plot into the layout. Once the plot is selected the Plot tab will appear within the ribbon where a Multi plot type may be selected (Figure 5.270).

Figure 5.268. Multigraph Options in the Ribbon.
The available Multi Plot displays are, Histograms, All Parameters by X, All Parameters by Y, NxN Plots, NxN Compensation Viewer, and Color by All Parameters. The maximum number of parameters and font size can be adjusted in User Default Options for multiplots.
Once a multi plot type is selected, parameters may be included or excluded from the multi plot by checking or un-checking the appropriate box in the Select Parameter(s) window (Figure 5.271). Using the Filter: field a user can remove unwanted parameters from view to simplify selection. For example, if a user only wanted to select area parameters typing "-A" in the field would reduce the numbers of parameters seen in the parameter list. To select or deselect all parameters, right-click in the window to access the pop-up menu. Note for NxN Plots the creation of histograms displaying each selected parameter is optional.
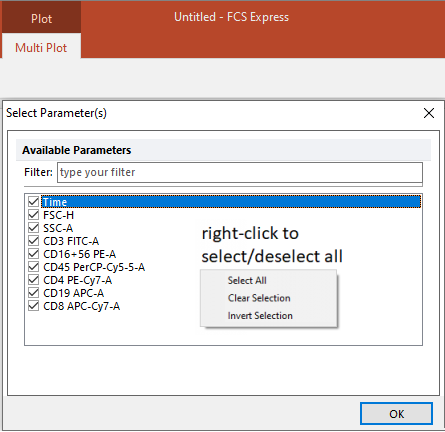
Figure 5.269. Select Parameter(s) window for Multi Plot's.
After creating a multi plot group, the plots making up the group will maintain the same formatting, gates applied, gates to display, and overlays as the parent plot. Plots can be formatted individually by selecting the individual plot or as multiple plots by selecting the entire multi plot group and selecting each plot you wish to format while holding the shift key. The multi plot will be a grouped object but plots can be ungrouped at anytime. To do so, select the entire multi plot and right click and select grouping→ungroup.
Please note that creating multi plots from data sets with a large number of parameters may reduce the performance of FCS Express due to the large number of plots created. The default options for the maximum number of histogram, parameters by X, and parameters by Y multi plots is 49. The default maximum number of NxN Plots and NxN Plots Compensated is 10. The default options may be increased via the User Default Options for multiplots.
•The Histograms option will insert 1D histograms of every parameter in the data set (Figure 5.272).
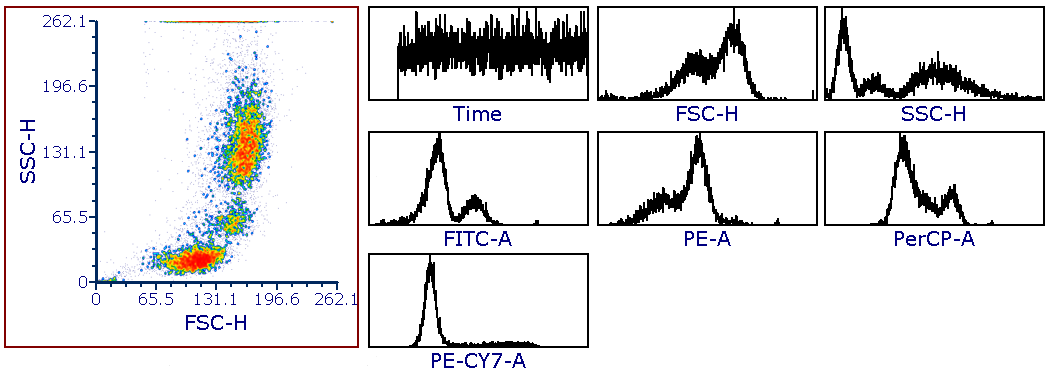
Figure 5.270. Parent Plot and Histograms Multi Plot.
•All Parameters by X will insert the 2D plot type of the parent plot with the X axis of the parent plot consistent across all plots. The Y axis will change for each parameter in the data set (Figure 5.273).
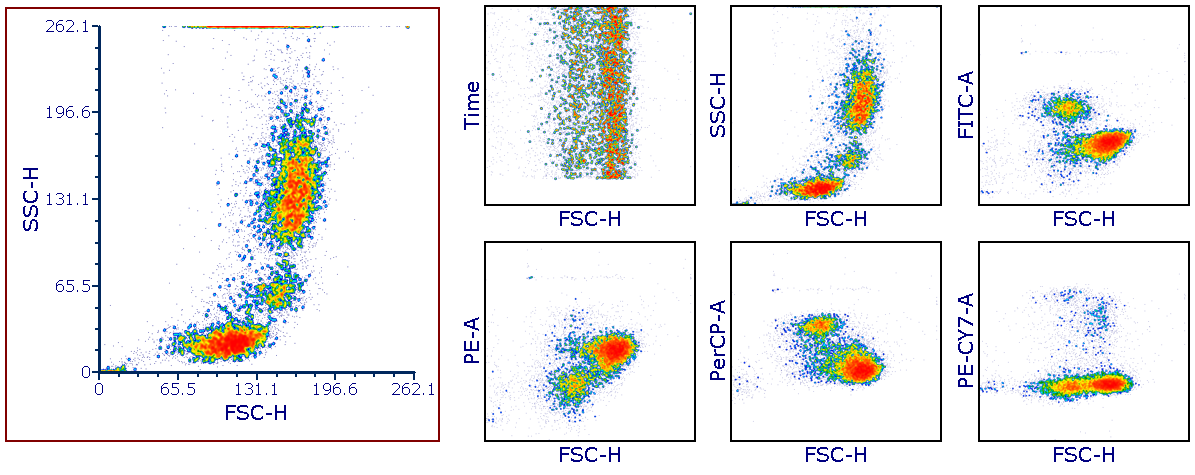
Figure 5.271. Parent Plot and All Parameters by X Plot.
•All parameters by Y will insert the 2D plot type of the parent plot with the Y axis of the parent plot consistent across all plots. The X axis will change for each parameter in the data set (Figure 5.274).
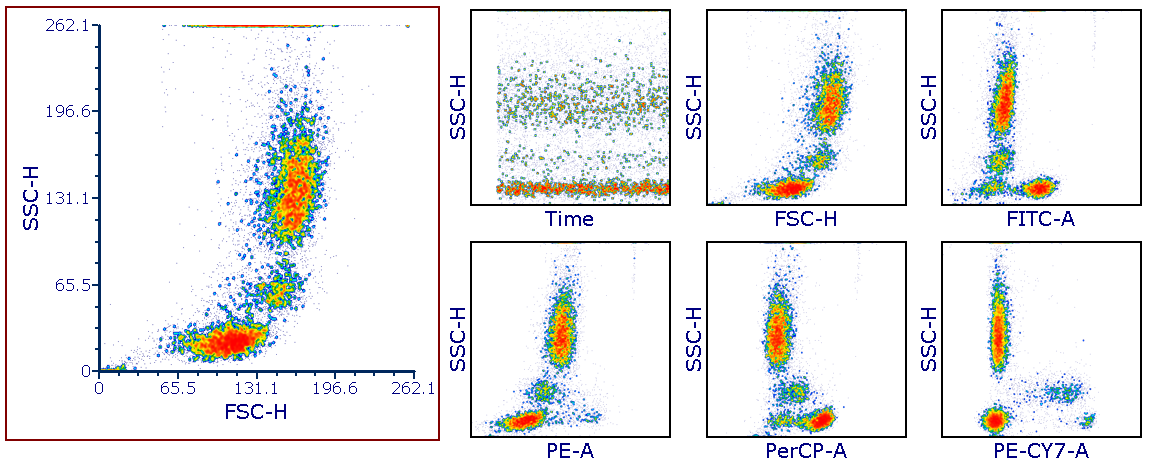
Figure 5.272. Parent Plot and All Parameters by Y Plot.
•NxN Plots will create multi plots that display combinations of all parameters (including time and scatter) versus each other (Figure 5.275). ):
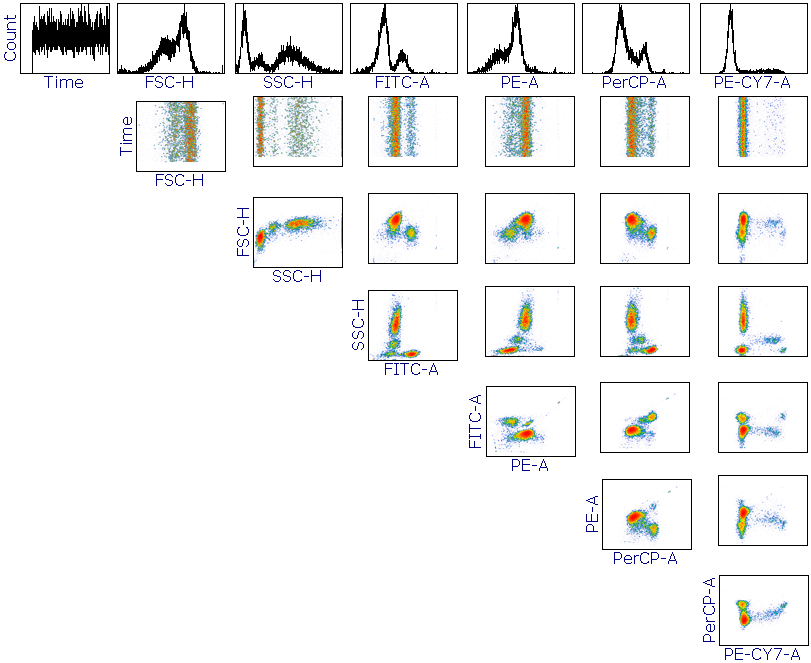
Figure 5.273. NxN Plots.
NxN Compensation Viewer will create Multi Plots that display combinations of all parameters versus each other of the parameters involved in the compensation matrix of the parent plot (Figure 5.276). The background color of plots will change to match the color shown for the spillover value of the Y-axis parameter (source) and the X-axis parameter (target) in the Compensation/Unmixing window.
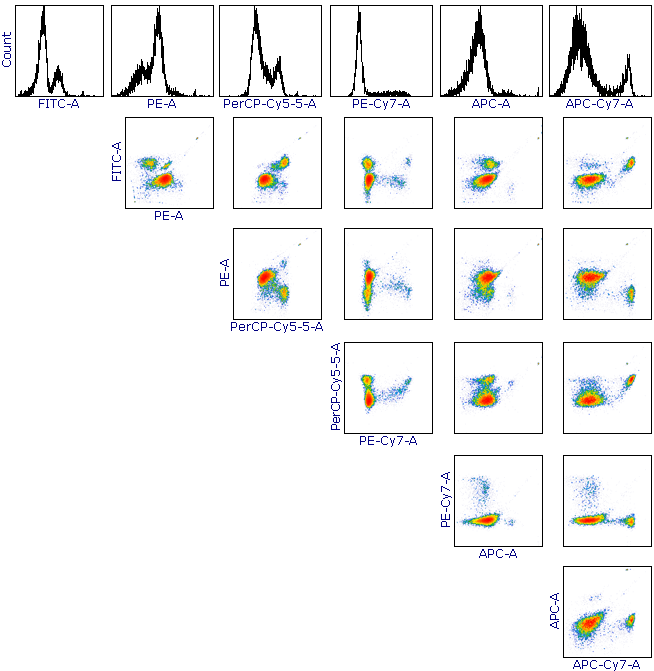
Figure 5.274. NxN Plots Compensated.
•Color by All Parameters will create Multiplots from Density, Contour and Heat-map plots in which the color mapping is defined by the Color Based On selection. It is most useful for transformations such as tSNE, UMAP, FlowSOM and SPADE,... to quickly investigate the distribution of multiple parameters of interest on the corresponding map. Figure 5.277 shows an example of Color by All Parameters Multiplot on a tSNE map using a Density plot
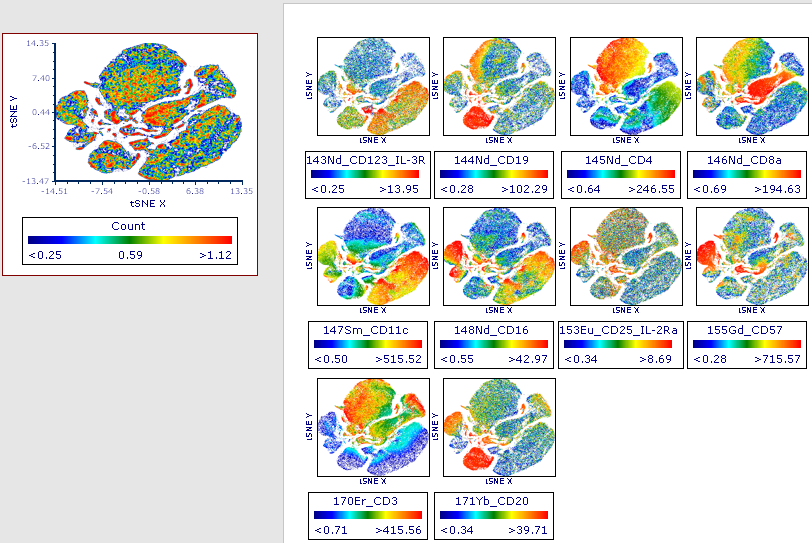
Figure 5.275. Color by All Parameters.
Note: When creating the Multi Plots for a tSNE or UMAP transformation, the source plot should be set so that tSNE-X and -Y or UMAP-1 vs -2, respectively, are displayed on the X- and Y-axes (i.e., as shown in the plot in the upper-left corner above). Also, ensure that the Legend is displayed on the Multi plot group, to denote the parameter on which the coloring is based for each plot within the group.
Figure 5.278 shows an example of Color by All Parameters Multiplot on a FlowSOM transformation using a Heat Map.

Figure 5.276. FlowSOM transformation displayed on a multiplot colored by all parameters.
