Scatter With Regression
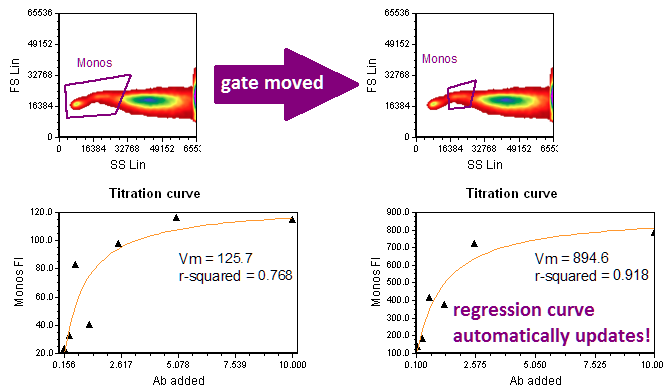
FCS Express can display data from a Spreadsheet or any file as a Scatter with Regression Plot which automatically overlays one or multiple best-fit regression curves of your choice onto your data. The resulting regression parameters can be extracted and added as statistical tokens anywhere on your layout. The regression curve will update as you adjust your gates or advance through your dataset, as shown in Figure 5.253 below:

Figure 5.251 Scatter with Regression Plot updating as gate is moved.
