Manually Editing a Compensation Matrix from a 2D Plot
To adjust the compensation definition from a 2D plot itself:
1.Right-click on the plot and select Show Compensation Adjustment Sliders from the right-click menu.
2.A submenu will open listing all the compensation definitions used on the plot (maximum one per overlay).
3.Select the compensation to edit from the submenu.
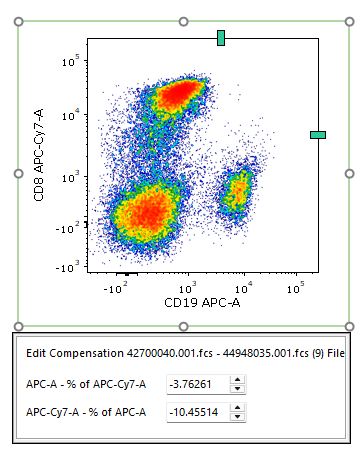
4.Two green sliders will appear on the right and top edge of the plot and one Edit Compensation dialog will appear close to the plot, showing parameter pairs and the current compensation values (Figure 9.17). The Edit Compensation dialog can be moved in case it overlaps with other objects on the page.

Figure 9.17 The Compensation Sliders and the Edit Compensation dialog.
5.Either act on the green sliders or use the Edit Compensation dialog to adjust the compensation. Arrows on the keyboard can also be used to move the green sliders on the plot or to change values in the Edit Compensation dialog.
6.Click the Undo button ![]() or press Ctrl+z on your keyboard if you want to revert a single unwanted changes. Press Restore to revert multiple unwanted changes instead.
or press Ctrl+z on your keyboard if you want to revert a single unwanted changes. Press Restore to revert multiple unwanted changes instead.
7.The adjusted compensation can then either be assigned to a single file or to all files. Please refer to the Using Definition chapter for more details.
Note: If the Compensations window is open and displaying the compensation currently being edited, the Compensation Matrix and Spillover Matrix values will update in real time, as will all plots to which the compensation has already been applied.
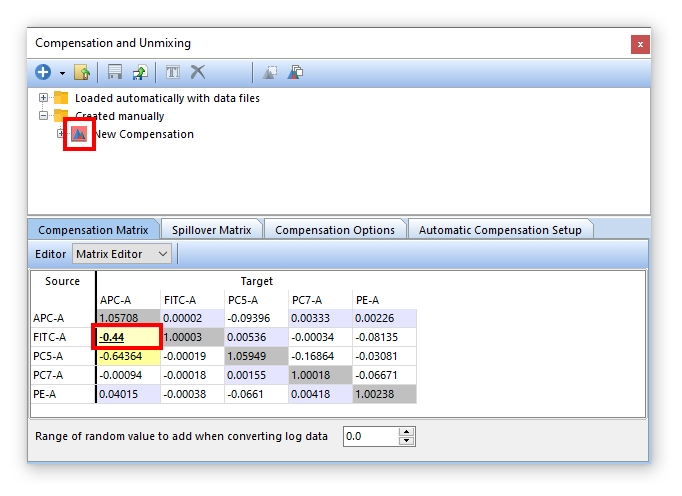
Note: when a compensation value is manually changed, the icon for the compensation in the Compensations window (Figure 9.18, red box at the top) will be highlighted with red and the text value in the Matrix Editor (Figure below, red box at the bottom) will become bold and underlined to indicate that the values for that compensation have been manually adjusted.

Figure 9.18. When a compensation value is manually adjusted, the compensation icon (red box at the top) becomes red highlighted, while the text value (red box at the bottom) becomes bold and underlined.
