ANOVA - Analysis of Variance
FCS Express allows you to perform single-factor Analysis of Variance (i.e. "single-factor ANOVA" or "One-way ANOVA") directly within the Integrated Spreadsheet.
In FCS Express there are four single-factor ANOVA functions that differ in:
1. Whether they require you to provide data in list form (i.e. ANOVA1.LIST and ANOVA1.LIST.P functions) or matrix form (i.e. ANOVA1.MATRIX and ANOVA1.MATRIX.P)
and
2. Whether they will output the full set of results one would expect from Microsoft Excel or simply the significance of the analysis (i.e. the functions ending in “.P” above).
ANOVA1.LIST and ANOVA1.LIST.P
These functions take either one or three comma-separated arguments in the order below. The second and third arguments are optional, but either both must be provided, or none. If neither is provided, the default values will be used.
1.A comma-separated list of three or more groups of data values.
2.A Boolean (“TRUE” or “FALSE”, wither with or without quotes) indicating whether the first element in each group should be interpreted as the label. Default is FALSE.
3.A digit (e.g. 0.123) indicating an alpha value. (Note: This is only relevant for the ANOVA1.LIST function, as it determines the value of Fcrit.). Default is 0.05.
Here is an example of how to use these functions:
ANOVA1.LIST or ANOVA1.LIST.P
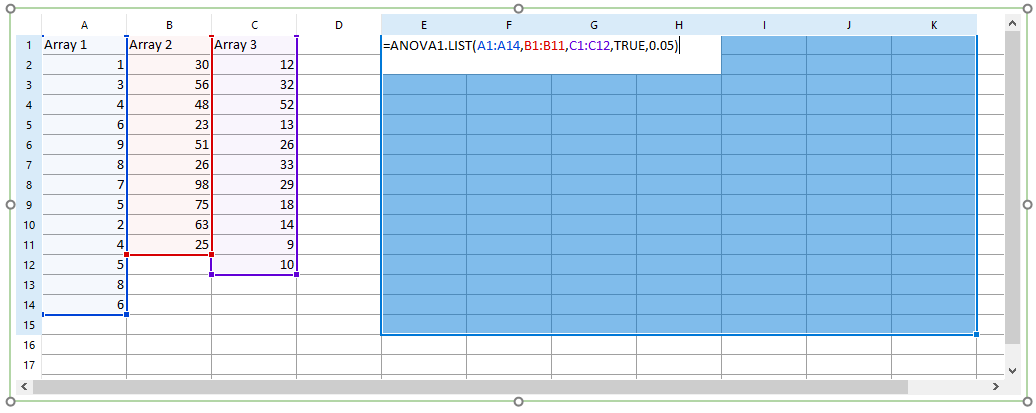
1.If you want to use ANOVA1.LIST.P select a single cell. If you want to use ANOVA1.LIST select a range of cells 7 columns wide and 12+n rows tall (where n is the number of data groups). In the example below, the ANOVA1.LIST formula is run on 3 data groups so the range of selected cells is 7 columns wide and 15 (i.e. 12+3) rows tall.
2.Press F2 on your keyboard so that the first cell of the selected cells enters the edit mode.
3.Enter the formula that you want to use. In the example below (Figure 5.216) the ANOVA1.LIST formula with the second and the third arguments specified is used.

Figure 5.214 - Example of using ANOVA1.LIST formula with multiple arguments.
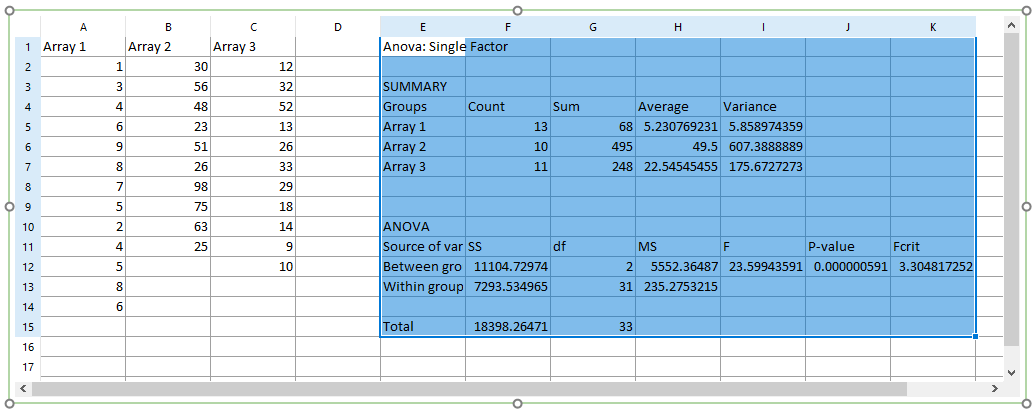
4.Press Ctrl+Shift+Enter. The area of the spreadsheet selected in Step 1 will be populated with the ANOVA results. In the example below (Figure 5.217) the ANOVA1.LIST formula is used, thus the full set of results is displayed.

Figure 5.215 - Results from ANOVA1.LIST formula reference.
ANOVA1.MATRIX and ANOVA1.MATRIX.P
These functions take either one or four comma-separated arguments in the order below. The second, third and fourth arguments are optional, but either all must be provided, or none. If none is provided, their default values will be used.
1.A 2D array of cells spanning at least three three or more groups of data values (i.e. at least three rows or columns depending on how the data are organized).
2.A Boolean (“TRUE” or “FALSE”, either with or without quotes) indicating whether the data are grouped by columns. Default is TRUE.
3.A Boolean (“TRUE” or “FALSE”, either with or without quotes) indicating whether the first element in each group should be interpreted as the label. Default is FALSE.
4.A numerical quantity (e.g. 0.123) indicating an alpha value. (Note: This is only relevant for the ANOVA1.MATRIX function, as it determines the value of Fcrit.). Default is 0.05.
Here is an example of how to use these functions:
ANOVA1.MATRIX or ANOVA.MATRIX.P
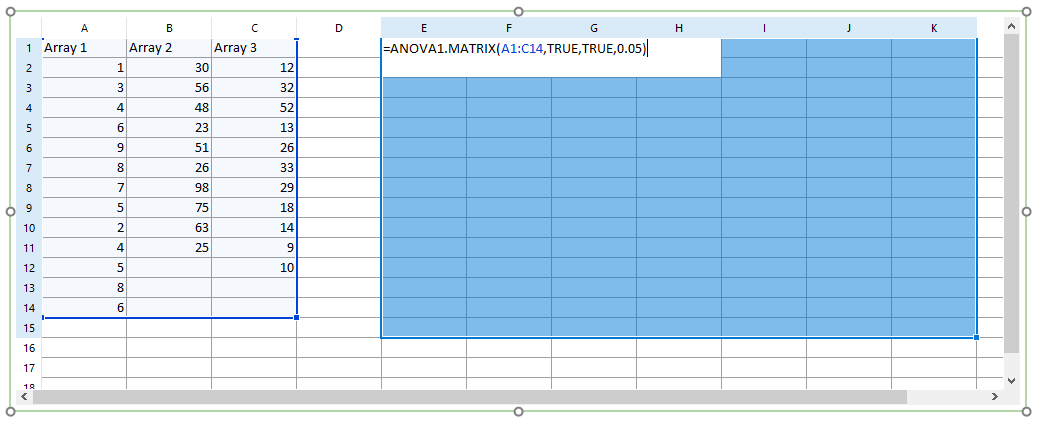
1.If you want to use ANOVA1.MATRIX.P select a single cell. If you want to use ANOVA1.MATRIX select a range of cells 7 columns wide and 12+n rows tall (where n is the number of data groups). In the example below, the ANOVA1.MATRIX formula is run on 3 data groups so the range of selected cells is 7 columns wide and 15 (i.e. 12+3) rows tall.
2.Press F2 on your keyboard so that the first cell of the selected cells enters the edit mode.
3.Enter the formula that you want to use. In the example below (Figure 5.218) the ANOVA1.MATRIX formula with the second, the third and the fourth arguments specified is used.

Figure 5.216 - ANOVA1.MATRIX formula with arguments defined.
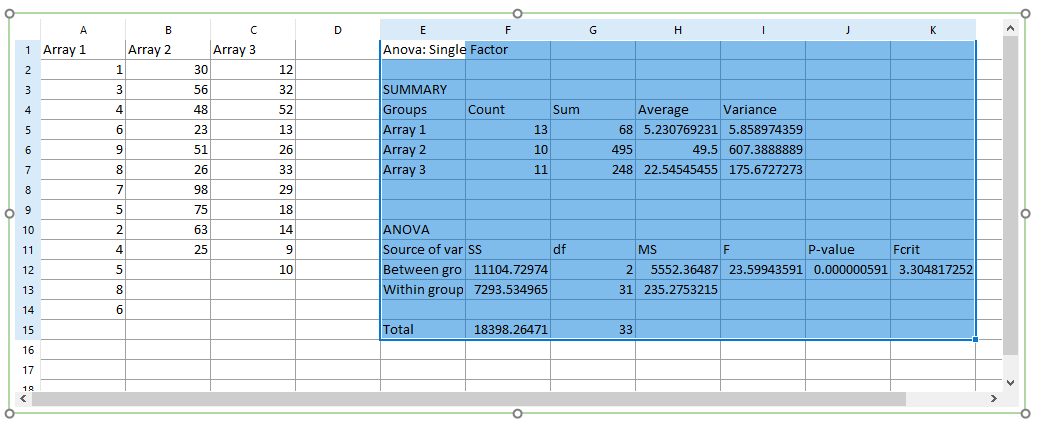
4.Press Ctrl+Shift+Enter. The area of the spreadsheet selected in Step 1 will be populated with the ANOVA results. In the example below (Figure 5.219) the ANOVA1.MATRIX formula is used, thus the full set of results is displayed.

Figure 5.217 - Results of ANOVA1.MATRIX forumla reference.
