Working with SPADE transformations

Contents
Once SPADE has been defined, it may be applied to empty Heat Maps in FCS Express. Please note when inserting a Heat Map for non-multiwell plate data, a warning message will appear (Figure 9.157).

Figure 9.158 Warning message when inserting a heat map for data sets not derived from a plate based data file.
Click Continue and proceed to apply the SPADE transformation by any of the methods below:
•Drag and drop SPADE from the Transformation navigator on to the intended plot (Figure 9.158). Note that the SPADE tree can only be displayed on Heat Map plots. However, applying the SPADE transformation on 1D and/or 2D plots is required for downstream analysis of SPADE results (e.g. back-gating of SPADE nodes on 1D and 2D plots).

Figure 9.159 Drag and drop SPADE from Transformations navigator to an empty heat map. When the transformation has been applied the heat map will populate with SPADE nodes.
•SPADE may be applied to individual or multiple plots by performing either option outlined in red in the Transformations window below (Figure 9.159).
")
Figure 9.160 Commands to Apply Transformation to Plot(s)
•Right-click the name of SPADE in the Transformations window and click Apply to selected plot or Apply to all plots button in pop up menu (Figure 9.160).
")
Figure 9.161 Commands to Apply Transformation to Plot(s)
•Access the Overlays formatting dialog and choose the SPADE transformation to apply from the Transformation drop down list (Figure below).
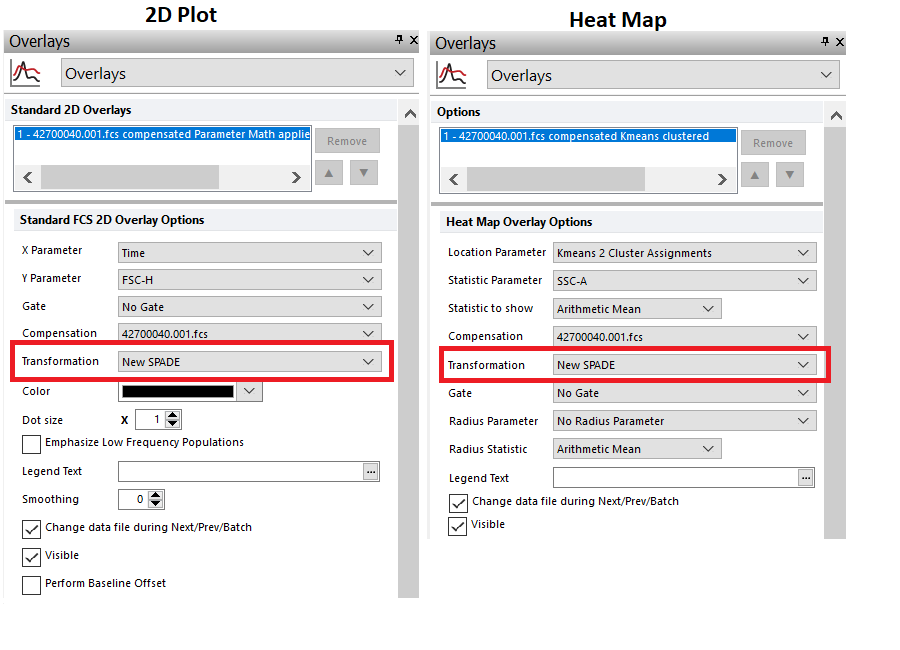
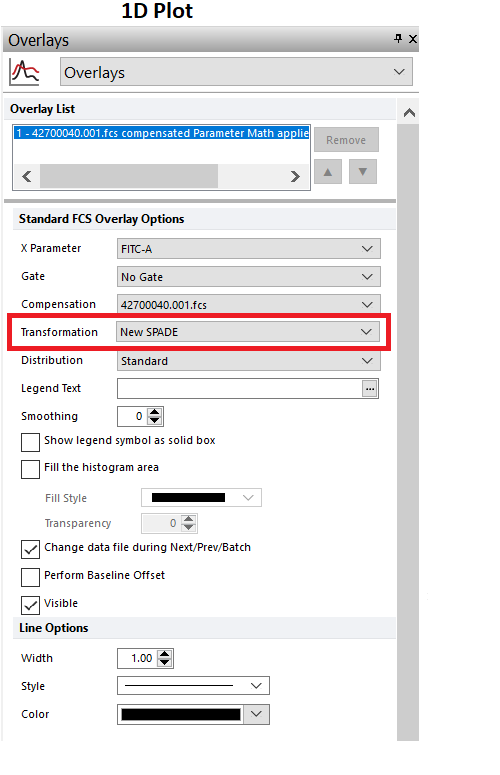
The result of both methods will be a plot that denotes SPADE tree in the title, outlined in red below (Figure 9.161).

Figure 9.162 Heat Map with title appended with SPADE tree, outlined in red.
Once SPADE is applied to the Heat Map, the following actions can be performed on the Heat Map:
•Have well size dependent on a statistic such as number of events in the node
•Set the Parameter and Statistic for display
•Change the Color Level and Color Scheme
•Create gate(s) to identify node(s) of interest, and edit other features