Axes
The Axis options control the appearance and text of the plot axes.
You can edit the Axes options in one of two ways:
•Select the plot(s) and use the Format→Plot Options→Axes command.
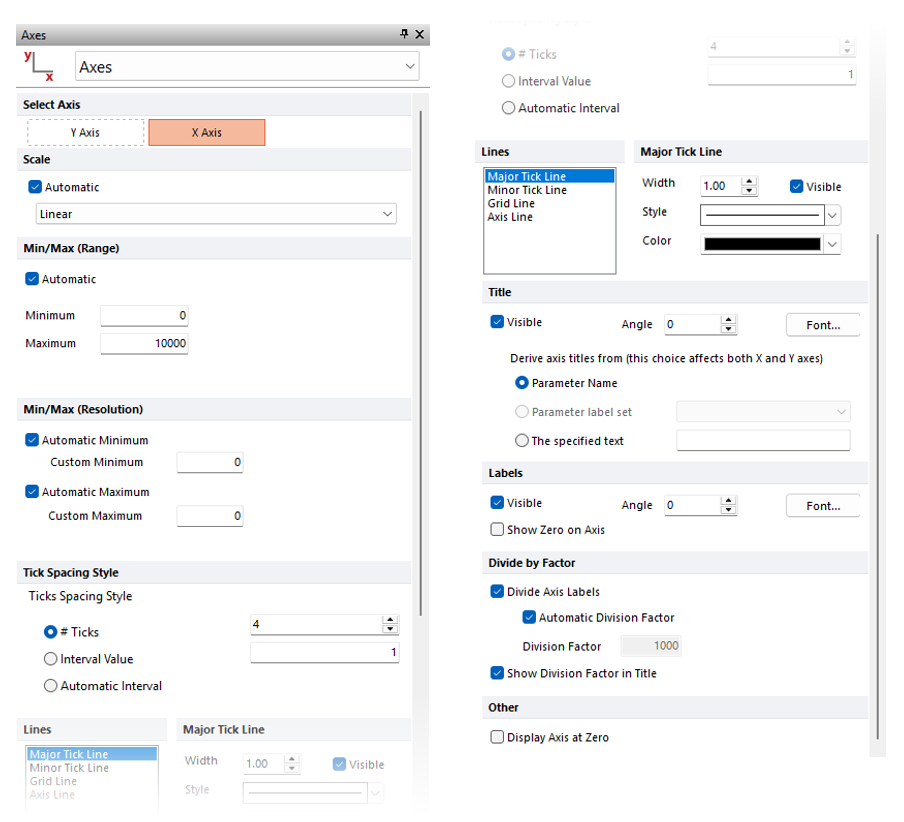
•Right-click on the plot, select Format this plot→Axis from the drop down (Figure 5.135).

Figure 5.135 Formatting Axes Dialog
The available options are explained below.
Option |
Explanation |
|---|---|
Select Axis |
Select the Y Axis or X Axis to determine which axis is currently being edited. |
Scale |
If Automatic scaling is checked, the axis will be shown in the scale chosen automatically by FCS Express according to the Instrument Specific Settings. You can override automatic scaling, and choose the axis scaling. Manual changes to the scale for a given plot parameter may be remembered and applied automatically to all plots in the layout editing your layout options. |
Axis Min/Max
Note: Depending on the plot type either the Resolution and/or the Range can be used to customize the Axis Min/Max. |
Min/Max (Resolution) oAutomatic Minimum. If checked, then FCS Express will start binning the data (i.e. dividing it into the number of bins specified by the Plot resolution) according to the Minimum defined in the Instrument Specific Settings. oCustom Minimum. Specify where to start binning the data. If Automatic Minimum is checked, then this value is ignored. oAutomatic Maximum. If checked, then FCS Express will finish binning the data (subdividing it into the number of channels specified by the Plot resolution) at the Maximum defined in the Instrument Specific Settings. oCustom Maximum. Specify where to finish binning the data. If Automatic Maximum is checked, then this value is ignored.
Min/Max (Range) oIf Automatic Range is checked then the Min/Max range values will automatically match the Min/Max resolution values. For the count axis on a histogram, if Automatic Range is enabled, the axis range will extend from 0 to the highest event count. If Automatic Range is turned off, the values below will be used instead. oMinimum. The minimum value to display on the axis. This option is only meaningful if automatic range is turned off. oMaximum. The maximum value to display on the axis. This option is only meaningful if automatic range is turned off.
|
Lines •Major Tick Line •Minor Tick Line •Grid Lines •Axis Lines |
Set the line visibility, width, style and color for the selected line. |
Ticks Spacing Style
Note: This only applies to Linear scaled axis.
|
Allows the user to customize how tick marks appear on the axis. • # Ticks. The number of ticks to show along the axis can be specified. • Interval Value. Display ticks at specific intervals i.e 10,000. • Automatic Interval. Display ticks at intervals automatically determined by FCS Express. |
Title |
Set the visibility, specific text, font style, size, color, and angle for the title of the axis parameter. |
Derive Axis Titles From |
Choose Parameter Name, a Parameter label set (if a label set has been defined), or the text specified in the Text field (under Title). |
Labels |
Visible: Set the visibility, font style, size, color, and angle for the numbers which label the scale. Show Zero on Axis: Allows to show the zero on the axis which may not be visible. |
Divide by Factor |
Divide the nominal axis labels by a given factor, and choose whether or not to show the factor in the Axis title. |
Other - Display Axis at Zero |
If Display axis at zero is checked, the axis currently being edited will be displayed at zero rather than at the plot origin. |
