Creating Data Specific Gates
In this section, you will learn the various ways to create a Data Specific Gate. This tutorial will show you how to adjust a gate's position, size, and shape to be separate from the universal placement and specific to the data file(s) of interest. The layout used has three plots displaying three different data files and using Gate 1 to identify a subset of interest:
Plot 1 - TCellSample1.fcs compensated
Plot 2 - TCellSample2.fcs compensated
Plot 3 - TCellSample3.fcs compensated
1.Open the DataSpecificGates.fey layout from the Tutorial Sample Data folder.
2.Move Gate 1. While moving the gate, observe the other two gates move as well. The default behavior is 2D gates are universal for all samples of the layout. Review Moving Gates for additional information.
3.On Plot 2, click inside Gate 1.
4.Click Gating tab→Data Specific Gate command  .
.
5.Click and drag upper-left anchor of Gate 1 on Plot 2 to resize and make it smaller. Release mouse button. It should resemble Figure T4.36.
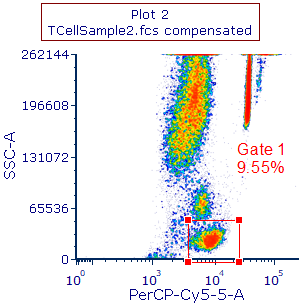
Figure T4.36 Resizing Gate 1 for Plot 2 after Activating Data Specific Gate Command from Ribbon
6. Move Gate 1 on Plot 2; it should move independently (i.e. the gate should not move on plots 1 and 3). Data file TCellSample2.fcs now has Gate 1 as a Data Specific Gate.
7. Click once on Plot 3.
8. Hold Shift on keyboard and click to move Gate 1 on Plot 3. Release mouse button and Shift key. Gate 1 will become data specific for TCellSample3.fcs.
9. Click Gating tab→Polygon command and create new gate shape on Plot 3, resembling Figure T4.37, black vertices.
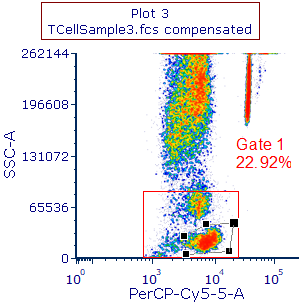
Figure T4.37 Creating New Shape for Gate 1 on Plot 3
10. Choose Replace an existing gate in Create New Gate dialog and click OK.
11. Click and drag Gate 1 from Plot 1 to white space below it, and then release mouse button. A new plot should appear, resembling Figure T4.38
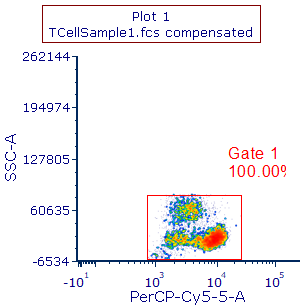
Figure T4.38 New Plot from Dragging and Dropping Gate 1 from Plot 1
12. Change X-axis to FITC-A by clicking axis label and selecting FITC-A from pop up list.
13. Double-click plot and choose Title category in Formatting dialog and change "Plot 1" to "Plot 4" (Figure T4.39, red outline).
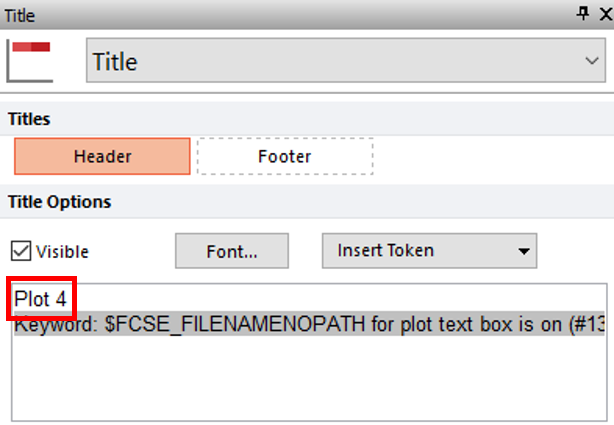
Figure T4.39 Editing Plot Title
14. Click Gating tab→Rectangle command and create new gate on plot.
15. Enter FITC+ in Create a new gate named field, expand the Gate Properties section of the dialog and check the check box next to Always create a Data Specific Gate when moving this gate in Create New Gate Dialog (Figure T4.40).
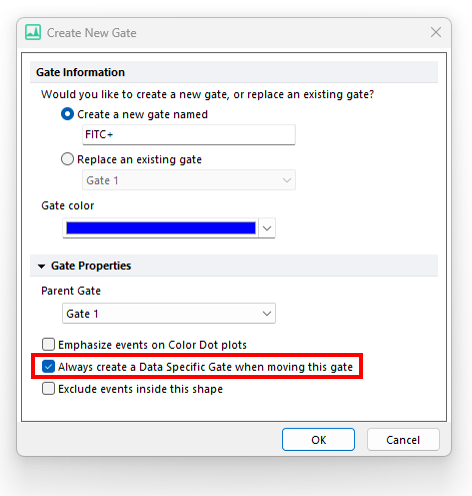
Figure T4.40 Making Data Specific Gate from Create New Gate Dialog
Plot 4 should now resemble Figure T4.41.
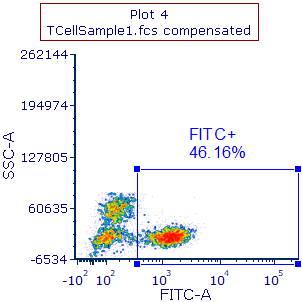
Figure T4.41 New Plot after Creating FITC+ Gate, which is Data Specific Once Moved
Note: Please save this layout to your desktop if unable to complete the next tutorial section.
