Creating Markers
In the course of this example, we will:
•Open a previously created layout.
•Create a marker on a histogram.
•Resize the marker by acting on the marker boundaries with the mouse.
Although any data files of your own can be used to follow along in this tutorial, you have the option of using the same sample data files used in this tutorial. The sample data files are located in the Tutorial Sample Data archive. The markers.fey layout and the ApoMono.001 data file will be used here.
To Open a Layout:
1.Select File tab→Open.
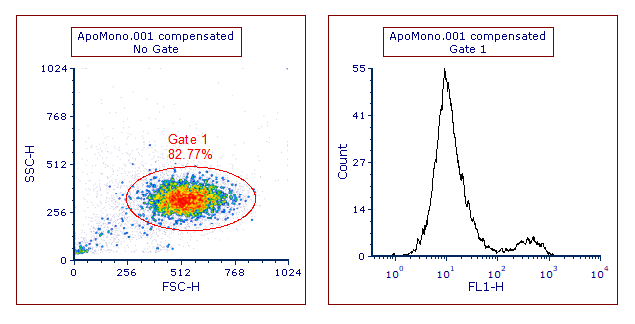
2.Select the section5.fey layout file located in the Tutorial Sample Data archive from the Load Layout dialog. A density plot with an Ellipse gate on it, and an histogram will be displayed on the page (see Figure T7.1 below)

Figure T7.1 The content of the markers.fey layout.
We will now create a marker on the histogram.
3.Click the Gating tab→Create Gates group→ Marker  command (Figure T4.3,
 ![]() ).
).
You will know the button is selected because it will have a darker grey background ![]() .
.
We will create the marker on the histogram (i.e. rightmost plot).
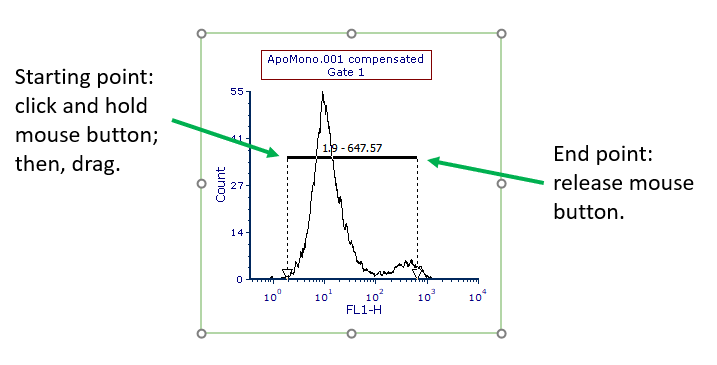
9. Move the cursor on the plot wherever you would like the gate to begin.
10. Click and hold the left mouse button.
11. While holding, drag cursor across the histogram. (Figure T7.2 below).
12. Release the mouse button.

Figure T7.2
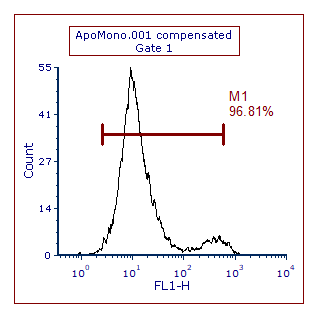
13. A marker will now appear on the histogram2D plot (Figure T7.3 below).

Figure T7.3
