Data Navigator Features
As shown in Figure T13.6, the Data Navigator is organized by the data files in the layout. Under each data filename, is the list of the plots which are using that data file. We will now explore the many features of the Data Navigator.
1.Hover the mouse over the 9 - Density – TCellSample3.fcs compensated (APC-Cy7-A vs PE-Cy7-A), under the data file listing for TCellSample3.fcs, within the Data Navigator, as indicated by the cursor in Figure T14.7.
A thumbnail image of the actual 2D plot will appear, as shown in Figure T14.7. This is a helpful quick reminder of which plot is associated with a data file, particularly if that plot is not currently visible. This feature applies to any of the plots listed in the Data Navigator.
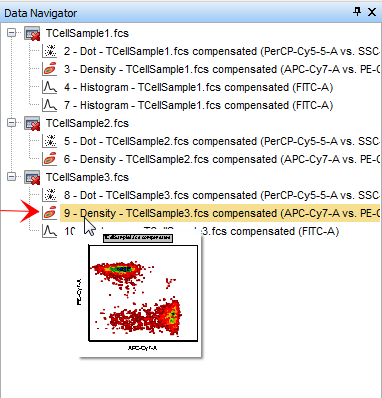
Figure T14.7 Thumbnail Image of a 2D Plot on the Data Navigator
We will use the Data Navigator to change the data displayed in a 2D plot. We will replace the TCellSample1.fcs data in the 1D plot in the lower right of the layout with the TCellSample2.fcs data using just the Data Navigator.
2.Place the cursor over data file TCellSample2.fcs in the Data Navigator, highlighted in blue in Figure T14.8.
3.Press and hold the left mouse button.
4.Drag the TCellSample2.fcs data file up to the plot listing 7 – Histogram – TCellSample1.fcs compensated (FITC-A), indicated by the cursor and highlighted in blue in Figure T14.8.
5.Release the mouse button when the TCellSample2.fcs data file is on top of the listing 7 – Histogram – TCellSample1.fcs compensated (FITC-A).
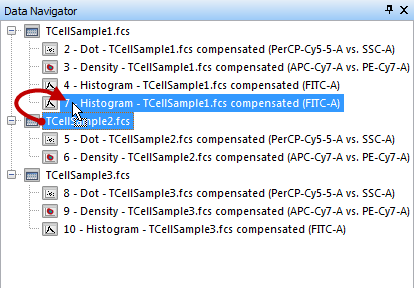
Figure T14.8 Dragging TCellSample2.fcs data file onto a 1D plot in the Data Navigator
The Select Drag and Drop Action dialog appears, as shown in Figure T14.9.
6.Select replace the existing overlays in the plot (Figure T12.9).
7.Click OK.
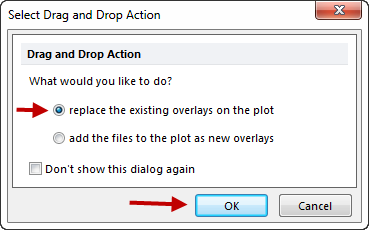
Figure T14.9 Select Drag and Drop Action Dialog
The 1D histogram in the lower right of the layout is now selected and updates to reflect the TCellSample2.fcs data, outlined in green in Figure T14.10.
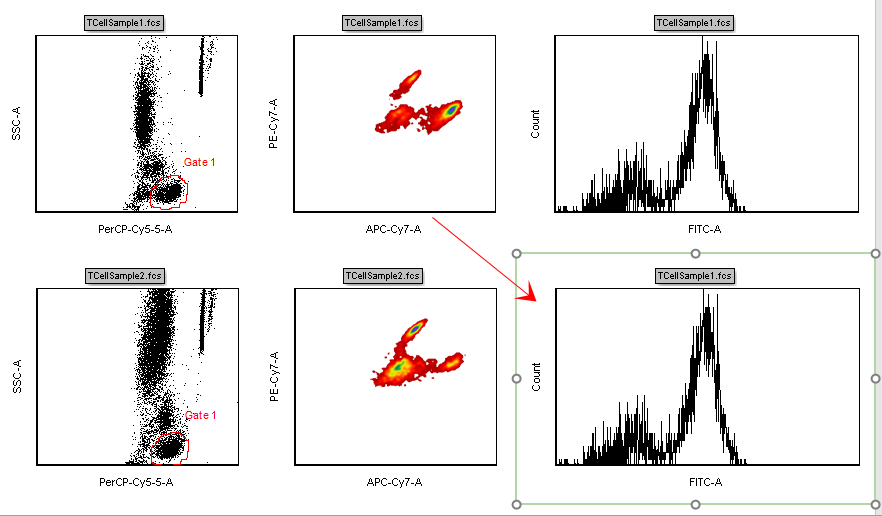
Figure T14.10 Selected and Updated 1D Histogram with TCellSample2.fcs Data
The Data Navigator is also updated to reflect the changes, as shown in Figure T14.11. The plot 7 – Histogram – TCellSample2.fcs compensated (FITC-A) appears under the TCellSample2.fcs data file listing, as indicated by the cursor and the thumbnail image in Figure T14.11.
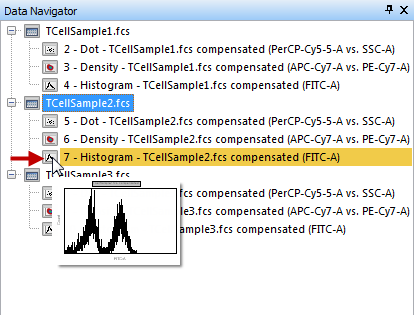
Figure T14.11 Data Navigator Updated to Reflect TCellSample2 Plot Changes
We now will use drag and drop in the Data Navigator to overlay data on a histogram.
8. Place the cursor over data file TCellSample2.fcs in the Data Navigator, highlighted in blue in Figure T14.12.
9. Press and hold the left mouse button.
10. Drag the TCellSample2.fcs data file up to the histogram plot listing 4 – Histogram – TCellSample1.fcs compensated (FITC-A), indicated by the cursor and highlighted in blue in Figure T14.12.
11. Release the mouse button when the TCellSample2.fcs data file is on top of the histogram listing.
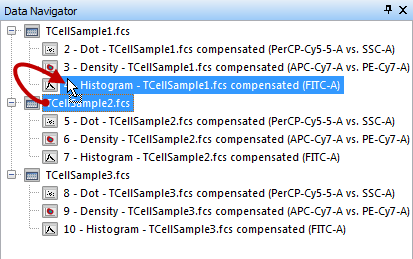
Figure T14.12 Dragging TCellSample2 onto a Histogram Plot in the Data Navigator
The Select Drag and Drop Action dialog appears, as previously shown in Figure T14.9. However, this time we will change the selection on the dialog to allow the data to be overlaid on the histogram.
12. Select "add the files to the plot as new overlays".
13. Click OK.
The histogram in the upper right of the layout is now updated to reflect the overlay of the TCellSample2.fcs data. The histogram plot is shown outlined in green and the new overlay data is shown in red in Figure T14.13.
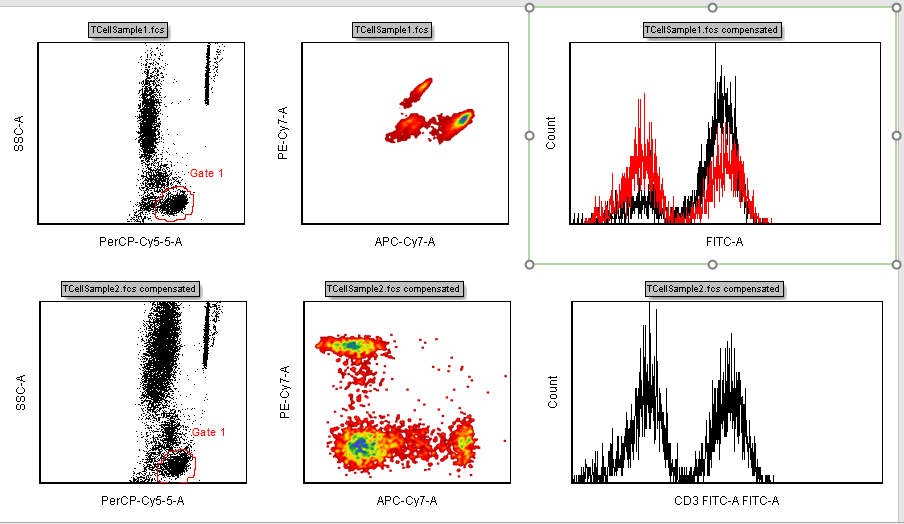
Figure T14.13 Histogram Updated to Show the Overlay of TCellSample2 Data
Again, the Data Navigator also updates to reflect the changes as shown in Figure T14.14. Under the data file listing for TCellSample2.fcs, a listing now appears for 4 – Histogram – TCellSample1.fcs compensated (FITC-A), as indicated by the cursor and the thumbnail image in Figure T14.14. The sub-listing Overlay 2 also appears under the histogram listing to indicate that the data file TCellSample2.fcs is the second overlay on the TCellSample1.fcs histogram. Note that under the TCellSample1.fcs data file listing, the histogram 4 – Histogram – TCellSample1.fcs compensated (FITC-A) listing has also been updated with the sub-listing Overlay 1 to indicate that the data ApoMono.001 is the base data.
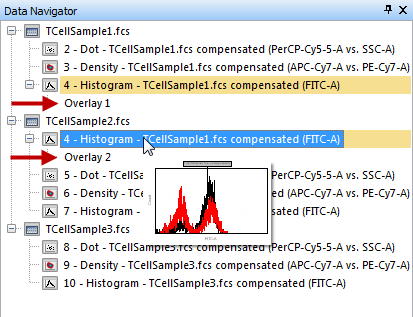
Figure T14.14 Updated Data Navigator with Overlay of TCellSample2 Data
All the previous actions of dragging and dropping data in the Data Navigator could also have been done using the Data Navigator pop up menu. We will now use the Data Navigator pop up menu to add data as another overlay to the histogram in the upper right of the layout.
14. Place the cursor over the TCellSample3.fcs data file listing on the Data Navigator, shown highlighted in blue in Figure T14.15.
15. Right-click to bring up the associated pop up menu.
16. Select Copy from the pop up menu, indicated by the red arrow in Figure T14.15.
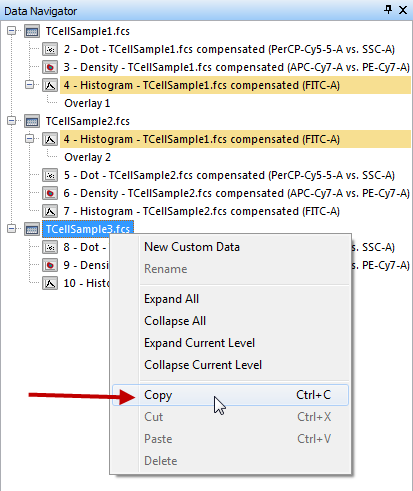
Figure T14.15 Copy Using Data Navigator Popup Menu
17. Place the cursor over the listing 4 – Histogram – TCellSample1.fcs compensated (FITC-A) listed under TCellSample1.fcs data on the Data Navigator, shown highlighted in blue in Figure T14.16.
18. Right-click to bring up the associated pop up menu.
19. Select Paste from the pop up menu, indicated by the red arrow in Figure T14.16.
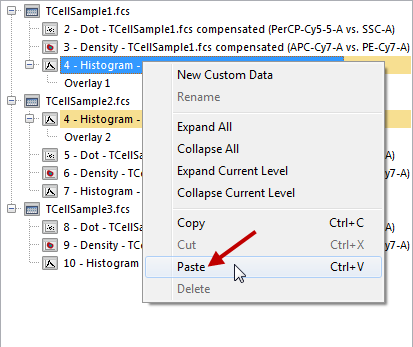
Figure T14.16 Paste Using Data Navigator Popup Menu
The Select Drag and Drop Action dialog appears, as previously shown in Figure T14.9. However, we will change the selection on the dialog to allow the data to be overlaid on the histogram.
20. Select "add the files to the plot as new overlays".
21. Click OK.
The histogram in the upper right of the layout is now updated to reflect the overlay of the ApoMono.003 data. The histogram is shown outlined in green and the new overlay data is shown in blue in Figure T14.17.
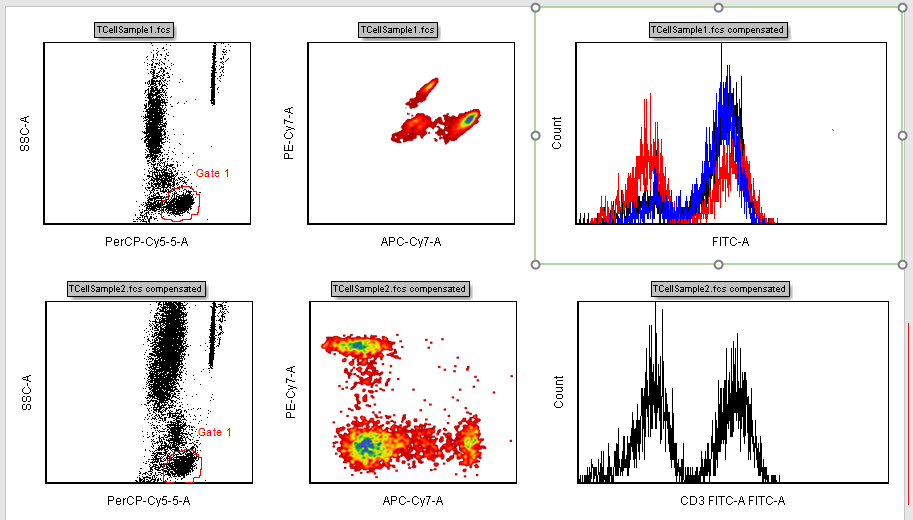
Figure T14.17 Histogram Updated to Show the Overlay of TCellSample3 Data
Again, the Data Navigator updates to reflect the changes as shown in Figure T14.18. Under the data file listing for TCellSample3.fcs, a listing now appears for 4 – Histogram – TCellSample1.fcs compensated (FITC-A), as indicated by the cursor and the thumbnail image in Figure T14.18. The sub-listing Overlay 3 also appears under the histogram listing to indicate that the data file TCellSample3.fcs is the third overlay on the TCellSample1.fcs histogram.
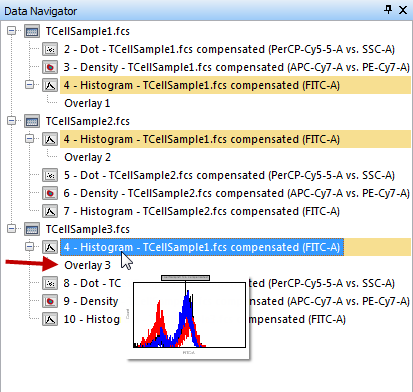
Figure T14.18 Updated Data Navigator with Overlay of TCellSample3 Data
We also can drag and drop data from the Data Navigator to either replace or overlay data within the plots on the pages of our layout.
We will drag a data file from the Data Navigator onto a plot on the layout. On the layout, the dot plot of SSC-A vs. PerCP Cy5.5-A, in the lower left corner of Page 1, is using the data TCellSample2.fcs. We will overlay that with TCellSample1.fcs data.
22. Place the cursor over data file TCellSample1.fcs in the Data Navigator, highlighted in blue in Figure T14.19.
23. Press and hold the left mouse button.
24. Drag the data file TCellSample1.fcs onto the layout.
25. Release the mouse button when TCellSample1.fcs is on top of the dot plot of SSC-A vs. PerCP Cy5.5-A, in the lower left corner of Page 1, indicated by the cursor and outlined in blue in Figure T14.19.
26. In the Select Drag and Drop Action window, select add the files to the plot as new overlays.
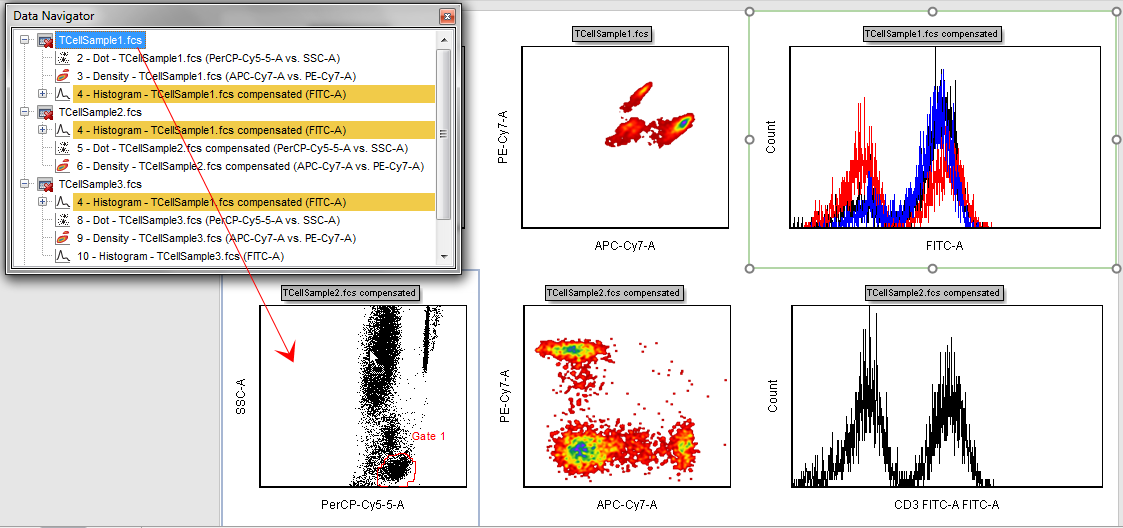
Figure T14.19 Dragging and Dropping TCellSample1 from the Data Navigator onto the Dot Plot on the Layout
Both the dot plot on the layout, in the lower left, and the Data Navigator have updated to reflect the data change, as shown in Figure T14.20. The cursor and thumbnail image, shown in Figure T14.20 indicate the changes in the Data Navigator.

Figure T14.20 Updated Layout and Data Navigator with TCellSample1 Overlay
In addition to dragging the data file from the Data Navigator and dropping it onto the dot plot on the layout, we could have used the Data Navigator pop-up menu to copy the data object, and then used the pop-up menu on the layout to paste the data onto the dot plot. Just like all the other pop-up menus, the Data Navigator pop-up menus are accessed by right-clicking when the cursor is located over an item in the Data Navigator. We will now use the Data Navigator pop-up menu to insert a new data plot onto the layout.
27. Place the cursor over TCellSample3.fcs in the Data Navigator.
28. Right-click to bring up the associated pop-up menu.
29. Select Copy from the pop-up menu, as previously shown in Figure T14.15.
30. Click on Page 2 at the bottom of the layout, as shown in Figure T14.21.

Figure T14.21 Selecting Page 2
Page 2 of the layout will now appear as shown in Figure T12.22.
31. Place the cursor on an empty part of the layout.
32. Right-click to bring up the associated pop up menu, shown in Figure T14.22.
33. Select Paste from the pop up menu.
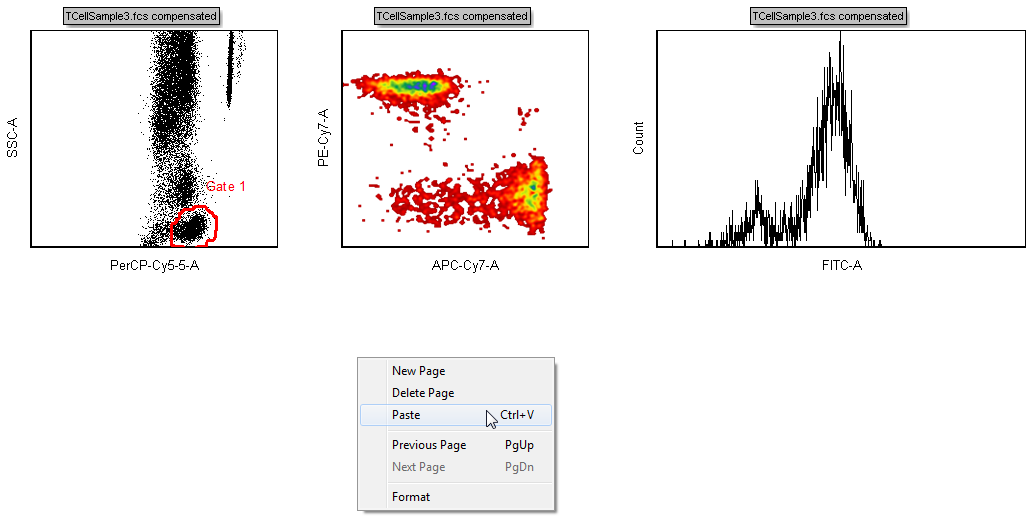
Figure T14.22 Page 2 of the Layout with the Popup Menu
The Select Plot Types… dialog appears, as shown in Figure T14.23.
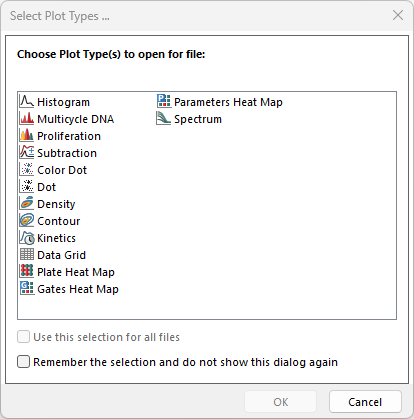
Figure T14.23 Select Plot Types... Dialog
34. Select Density as the types of plots to open.
35. Click OK.
A density plot of TCellSample3.fcs appear, using the default parameters of Time vs. FSC-H, as shown in Figure T14.24. Feel free to format this plot any way you wish.
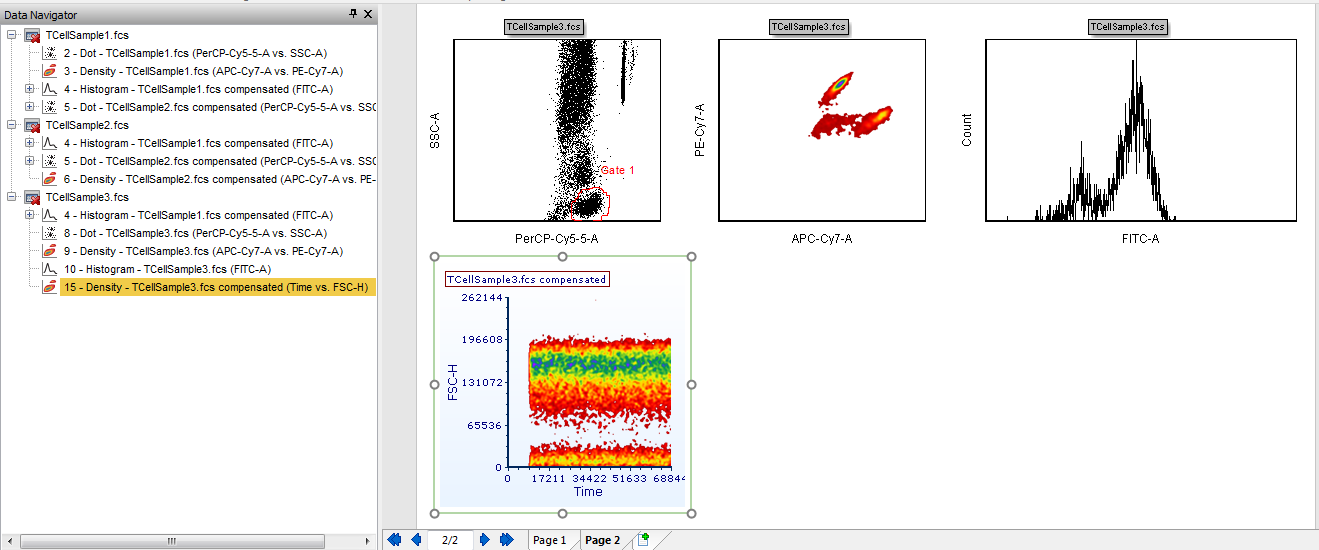
Figure T14.24 Contour Plot of TCellSample3.fcs Data
