Creating Dynamic Markers

Contents
The Dynamic markers feature automatically places a specified number of markers on a histogram such that each marker spans a peak.
How FCS Express positions the Dynamic Markers
1.The K-means clustering algorithm is run on the histogram data. The data input to K-means is scaled according to the current scale on the x-axis of the histogram.
2.The events are grouped into clusters. The number of clusters is the Number of Peaks specified by the user (see the Create New Dynamic Marker dialog below).
3.The center of each peak is identified.
4.The position of the low and the high bound of the marker are derived from the center of the peak and the Number of Standard Deviations specified by the user in the Create New Dynamic Marker dialog (see below for more details).
Adding Dynamic Markers to a Histogram
To add Dynamic Markers to a histogram, select the Gating tab > Markers > Dynamic Markers and click on the histogram.
The Create New Dynamic Marker window will appear (Figure 7.64).
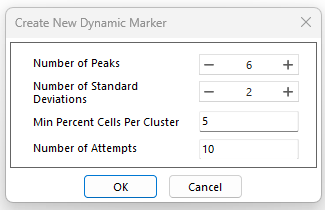
Figure 7.63
Here, the user should specify:
Options |
Description |
Number of Peaks |
The number of markers FCS Express should add to the histogram. It defines the number of clusters the events should be clustered by. It's equivalent to the number of centroids. |
Number of Standard Deviations |
The number of standard deviations (calculated on the k-means cluster) each bound of the marker should span from the center of the cluster. E.g. if "Number of standard deviations=2", the low and the high bounds of the marker will be placed at "cluster centroid - 2 SD" and "cluster centroid + 2 SD". |
Min percent Cells Per Cluster |
If in any iteration of K-means but the last one, a cluster contains less than this percentage of cells, that centroid is dropped and it's replaced with different cells from the dataset. |
Number of Attempts |
This is the number of the initial set of centroids that should be tested. |
Below is an example of dynamic markers that have been added to a histogram.
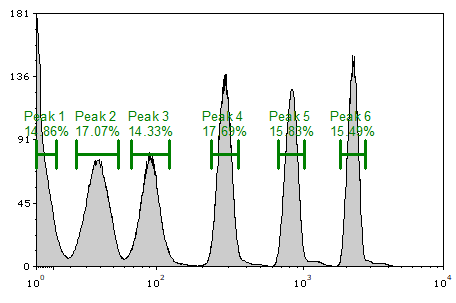
After the dynamic markers have been added to the histogram, the markers can be edited in the Markers category of the histogram's format menu.
Important Notes:
1.The X axis scale may need to be adjusted to help the algorithm identify the peaks correctly. This can be done in the Axes category of the histogram's format menu. In particular, for biexponential scale, the below zero parameter value may need adjustment.
2.As the plot changes, the dynamic markers will also adjust their positions to reflect the current state of the plot. For example, the markers can shift if:
•The data file on the plot changes
•The events displayed on the plot changes
•The axis scale changes
3.If a dynamic marker is manually moved on the histogram, it gets converted to a manual marker.