Formatting the Legend
Legends are useful to describe the data presented in your plots and to help distinguish between several data files that are overlaid onto a single plot.
In the course of this example, we will:
•Learn how to add an overlay to a histogram.
•Acquire an overview of legend formatting.
•Change the legend font.
•Change the legend position.
Note: If the When inserting a plot or displaying information from a data file, always display the selection dialog preference is selected all inserted plots or displaying information from a data file will open a dialog box. To disable this feature uncheck the box next to When inserting a plot or displaying information from a data file, always display the selection dialog (Figure T2.14, red outline).
In order to format the legend, we will first create a histogram with an overlay.
1.Open a new layout.
2.Insert a histogram and choose the data file ApoMono.001 in the Select data file dialog. If you do not know how to insert a histogram, see the Inserting Plots chapter of this tutorial.
3.Right-click the histogram.
4.Select Add Overlay from the pop-up menu.
5.Choose the ApoMono.002 data file without changing any other property.
6.Press OK to add the overlay.
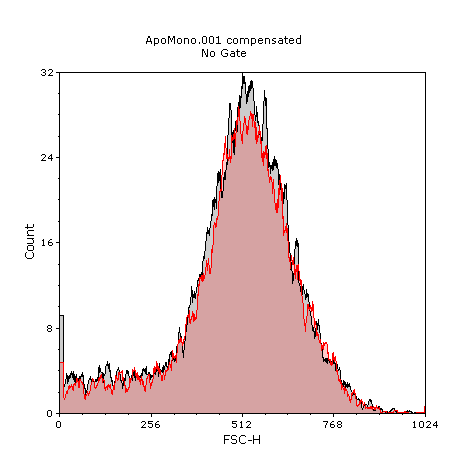
The histogram should resemble Figure T3.28. If the legend is already on your plot, your preferences may be set to add legends automatically.

Figure T3.28 Histogram with Two Overlays
To format the legend:
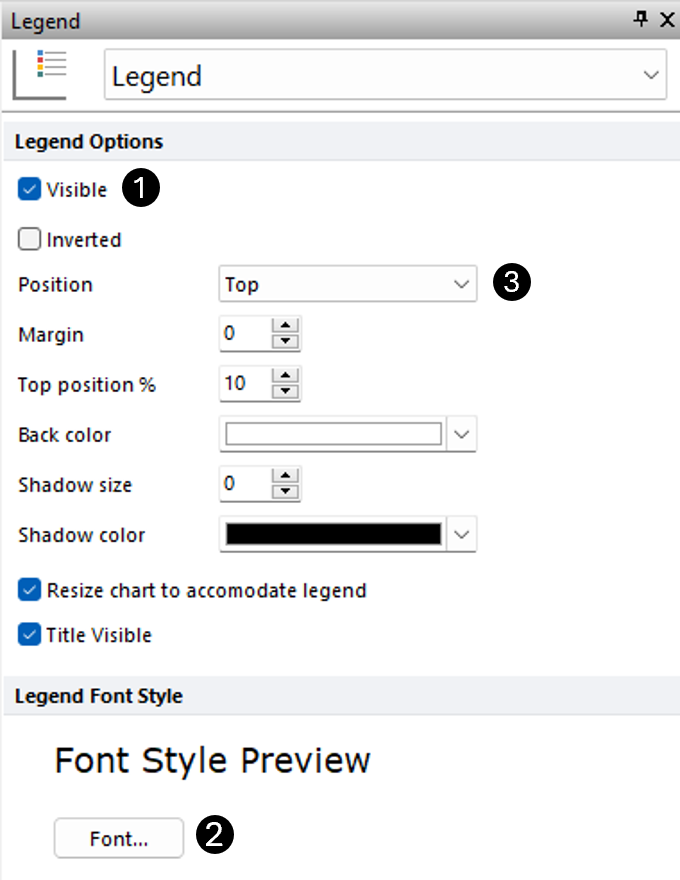
1.Double-click the histogram. The Formatting dialog appears, displaying the Axes category, and is docked to the right of the layout.
2.Select the Legend category.
3.Check box next to Visible if necessary (Figure T3.29, ![]() ).
).
4.The font in the legend can be customized the by clicking the Font button (Figure T3.29, ![]() ).
).
5.Change the Position drop-down to Top (Figure T3.29, ![]() ).
).

Figure T3.29 Formatting Legend Properties
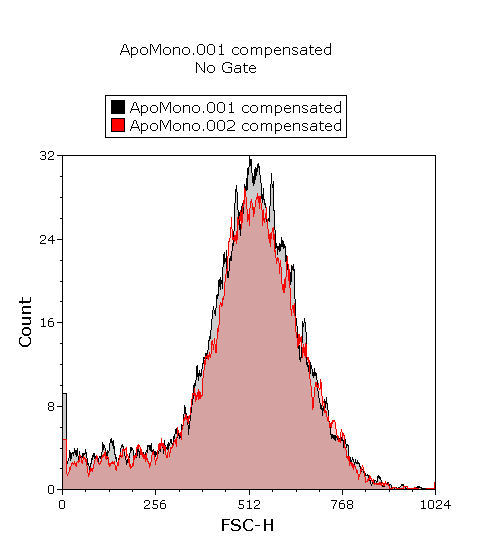
The plot should resemble like Figure T3.30.

Figure T3.30 Histogram with Formatted Legend
Note: Please save this layout to your desktop if unable to complete the next tutorial section.
Overlays can be formatted either as stacked or overlaid.
