Creating a Spreadsheet for analysis
In this section, we will:
•Create a Spreadsheet.
•Create and insert tokens and data into the Spreadsheet.
Because the IgG histogram scales are calibrated, we can use the MESF median values from the B- and T-cell histograms to construct a custom data set. Ultimately, we want the custom data set to tell us if serum from a patient sample is considered a "positive", "negative" or "weak" positive cross-match against the donor cells. To be able to do this, we have to define what is considered 'positive' or 'negative'. To aid in these definitions, multiple negative control serum samples are analyzed against the donor cells to determine the average FITC MESF value. The standard deviation is used to determine a significant "cut-off" value to use. We will assume that the FITC MESF values that define 'positive', 'negative' and 'weak' positive have already been determined.
We will begin by inserting a new blank page in the HLA Custom Data.fey layout from the previous "loading a layout for analysis" tutorial section, and then inserting a spreadsheet.
1.Select the Home tab→Pages group→New Page command. Alternatively, click on the New Page icon ![]() next to the Page 2 tab at the bottom of the layout.
next to the Page 2 tab at the bottom of the layout.
A new blank page appears.
2.Select the Insert tab→Spreadsheet and Charts group→Spreadsheet command  . Click on the layout where you want the spreadsheet to be inserted and a blank spreadsheet will appear.
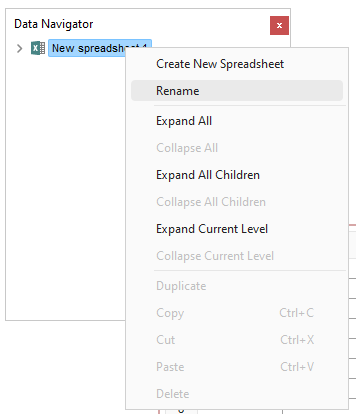
3.To rename the spreadsheet, right-click on "New spreadsheet 1" in the Data Navigator and select Rename. Type "HLA Cross-match" (Figure T16.4).
4.Click OK.

Figure T16.4 Rename New Spreadsheet
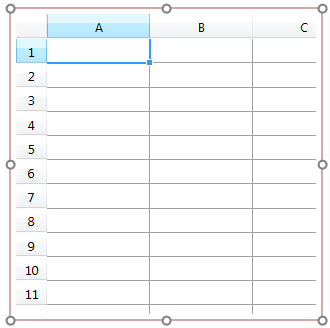
An empty spreadsheet will appear on Page 3 of the layout, as shown in Figure T16.5. If the spreadsheet appears on another page, you can cut and paste it onto Page 3 of the layout.

Figure T16.5 Empty Spreadsheet
In the next exercise, we will Populate the spreadsheet for analysis.
