Inserting a Spectrum Plot
Spectrum Plots are a special subset of the one-dimensional plot type that displays spectra for all events within a gating strategy as individual lines or an average of all events within a gating strategy as one line. Spectral lines for cells or particles are displayed as Counts (Y-axis) vs. wavelength (X-axis) for the specified laser line. Compensations and Unmixing and/or transformations may be applied to spectra displayed.
To insert a Spectrum plot, first ensure that the .fcs file and file type encoding the spectral data the same directory folder on your computer (details on file formats, structure and spectral data set preferences). Then, use the Insert→Special Plots→Spectrum command  .
.
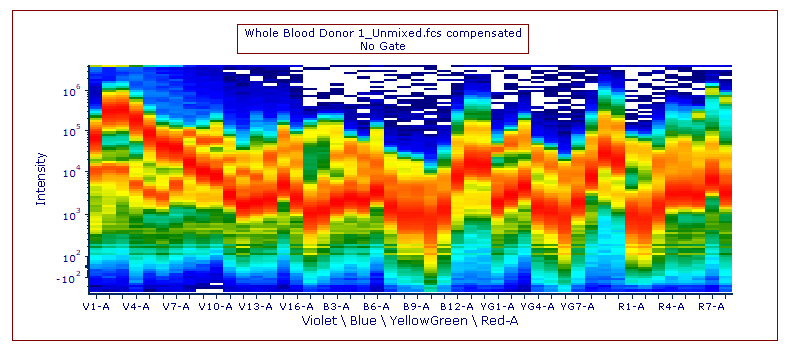
An example of a Spectrum Plot is shown below in Figure 5.55.

Figure 5.55 - Inserted Spectrum Plot
Spectrum plot can either display the spectrum for all plotted events just a single line representing the average of them (Format→Overlays→Overlays to show→All Spectrums/Average command).
When All Spectrum is selected, the Spectrum plot can either be colored based on the spectra density (Format→ Specific Options → Display Mode → Color on Density; see picture above as an example) or each line of it can be colored based on the gate/overlay in which the event falls (Format→ Specific Options → Display Mode → Color on Gated/Overlays).
When the Average is displayed, the color will be derived from Line options color.
See Formatting a Spectrum Plot for more information on these and other formatting options.
