Setting Up Pipelines

Contents
Pipelines are set up and run in FCS Express through the Transformations navigator.
The steps below outline the process of creating a new Pipeline transformation for your data:
1. To start creating a Pipeline Transformation, the main Pipeline element must be added from the Add a new transformation button in the Transformation window (Figure 9.162).

Figure 9.163 The Add new transformation button in the Transformation dialog.
The main Pipeline dialog window allows you to define the template file (a file from your experiment that contains the same parameters as others that the pipeline will be applied to), the input parameters for the pipeline based on the template file, and the scale that should be applied to each of parameter in the template file and downstream analysis. Any parameters that are not selected in the main pipeline element, will not be accessible in subsequent pipeline steps. An input gate for the pipeline transformation may also be defined in the main pipeline element and will be applied to other downstream steps (Figure 9.163).

Figure 9.164 The Pipeline main body dialog.
Main Pipeline Element Options (numbers refer to screen shot above):
1.Automatically Run Pipeline |
This check box allows users to set whether or not the Pipeline Transformation should be automatically run every time the main pipeline element or one of the downstream step(s) is added/remove/customized.
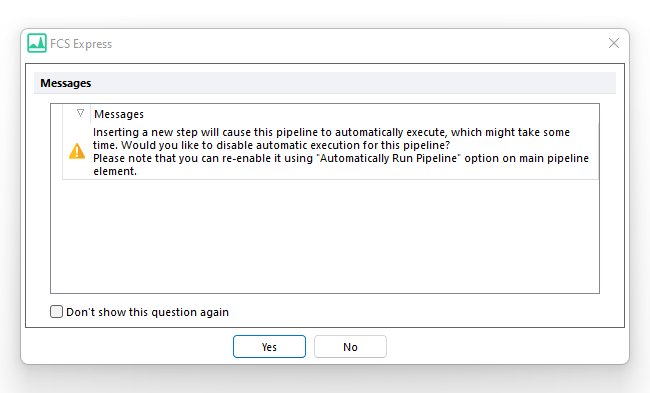
If this checkbox is checked and a step is added to the pipeline, and the pipeline is actually applied to an object in the layout, a message will open asking whether or not to uncheck this checkbox before adding the step.
|
2.Gate Options |
This section of the Pipeline Transformation allows you to choose a Gate for which events within the gate will be used during the transformation.
|
3. Template File |
The Template File for the pipeline transformation may be chosen by clicking on the ellipsis to the right of the Template File text box. Either a File or a Plot can be used as template file. If data is already loaded into your layout, the data file on the last selected plot will automatically appear as the template file. Selecting a Plot as Template is useful when compensated parameters are appended to non-compensated parameter (see the New Compensated Parameters Should setting in the Layout Options and Compensation Options section of the Compensation tool) so that both compensated and non-compensated parameters will be available in the pipeline.
Note: if you wish to define the pipeline transformation on your entire data set (multiple data files) rather than an individual data file, you can use a merged data file with a File Identifier Column as the Template File. The transformation may then be applied to the merged data file, and events therein may be related back to the original data files via the File Identifier Column.
|
4. Select parameters to use in the transformation |
The pipeline transformation dialog will be populated with a list of parameters based on available parameters from the template file (or selected plot). By default all parameters are selected so that all of them will be available for selection in the further steps. Parameters that are not selected in the main pipeline element, will not be displayed in further pipeline steps and will not be accessible on object displaying the pipeline result. Users may right-click in the parameter selection area to select all parameters, de-select all parameters, invert the selection, and sort the parameters. Multiple contiguous parameters can also be selected by holding Shift: select the first item, then click on the checkbox for the last item while holding Shift. All parameters in between will be selected. |
5. Filter |
A filter field is available to help search for parameters in your template file. When you begin to type in the filter field, FCS Express will display parameters that meet your criteria. Once you have selected your parameter of interest, you may delete the text in the filter field to reveal the full parameter list again. |
6. Display Name Suffix |
Modify the suffix that will be displayed in the plot title when the Pipeline Transformation is applied to a plot. |
Once the main Pipeline element is created, the Add Step button (blue Plus icon in the center of the Transformations dialog) is available and will allow you to add individual pipeline steps (Figure 9.164).

Figure 9.165The create a new pipeline step drop-down menu.
An example of a Pipeline Transformation with two steps is depicted below. Each step in a pipeline can be activated or deactivated by the check-box placed at the left of the step itself (Figure 9.165). If an upstream step is deactivated, the downstream step will not include the new parameters that would be defined by the upstream step until it is reactivated.

Figure 9.166 A two-steps Pipeline Transformation. At the left o each step, a check-box allow to activate or deactivate the step.
Pipeline steps may be arranged and re-arrange via dragging and dropping steps into the desired positions (Figure 9.166).

Figure 9.167 Pipeline steps can be reordered by drag and drop.
Steps may also be grouped in folders via the Miscellaneous Steps→Pipeline Folder. Using folders allows you to create your own groups of individual steps which increases the readability and the usability of the transformation dialog (Figure 9.167).
To rename a Pipeline Folder, select the folder by left clicking on it and the do either of the following:
•Click on the ![]() button in the Transformation dialog;
button in the Transformation dialog;
•Press F2 on the keyboard;
•Right click on the folder and select Rename.

Figure 9.168 Pipeline steps can be organized in fodler to increase the readability and the usability of the pipeline.