Setting up the Bead Gates
In the course of this example, we will:
•Learn how to gate beads using hierarchical gating.
For more information about inserting a plot, see the tutorial on that subject.
1.Open a new, blank layout.
2.Insert a forward (FSC-H) vs side scatter (SSC-H) dot plot of the file Monocytes.002 found in the Tutorial Sample Data folder.
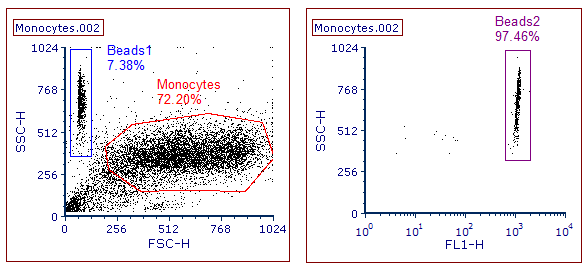
3.Create a polygonal gate around the monocytes, calling it Monocytes (Figure T24.1).
4.Create a rectangular gate around the beads, calling it Beads1 (Figure T24.1).
The gates should look similar to the ones shown in the plot on the left side of Figure T24.1. For more information on creating gates, please refer to the Gating tutorial.
5.Drag and drop the Beads1 gate outside of plot on blank, which space to create a second dot plot.
6.Change X- and Y-Axis to FL1-H vs SSC-H, respectively (Figure T24.1).
7.Draw a new rectangular gate around the beads in the new plot, calling it Beads2, as shown on the plot on the right side of Figure T24.1.

Figure T24.1 Gates for Monocytes and Beads
The Beads2 gate allows for added discrimination between the cells and the beads. Depending on how well separated the beads are from your sample, you can use an approach consisting of only one gate, but applying two gates generally allows for cleaner isolation of the bead events to exclude doublets and higher order aggregates.
Note: Please save this layout to your desktop if unable to complete the next tutorial section.
In the next section, we will use the Concentration Calculator tool.
