Using the Panel
In the course of this example, we will:
•Load new data into the layout we just created.
•Use the panel to analyze the other similar samples.
•Extend the layout easily using the panel set up in the previous steps.
1.Open the layout that you created in the previous section.
2.Open the Data List window if it is not already open.
3.Click on the blue plus icon ![]() in the Data List toolbar and select Add Data File to add data files to be analyzed.
in the Data List toolbar and select Add Data File to add data files to be analyzed.
4.Navigate to the tutorial sample folder and select file called Normal2_Tube1 (Figure T11.34, red arrow). Confirm FCS files (*.*; *.fcs; *.lmd) is selected for Files of Type drop down (Figure T11.34, red outline).
5.Select Open file.
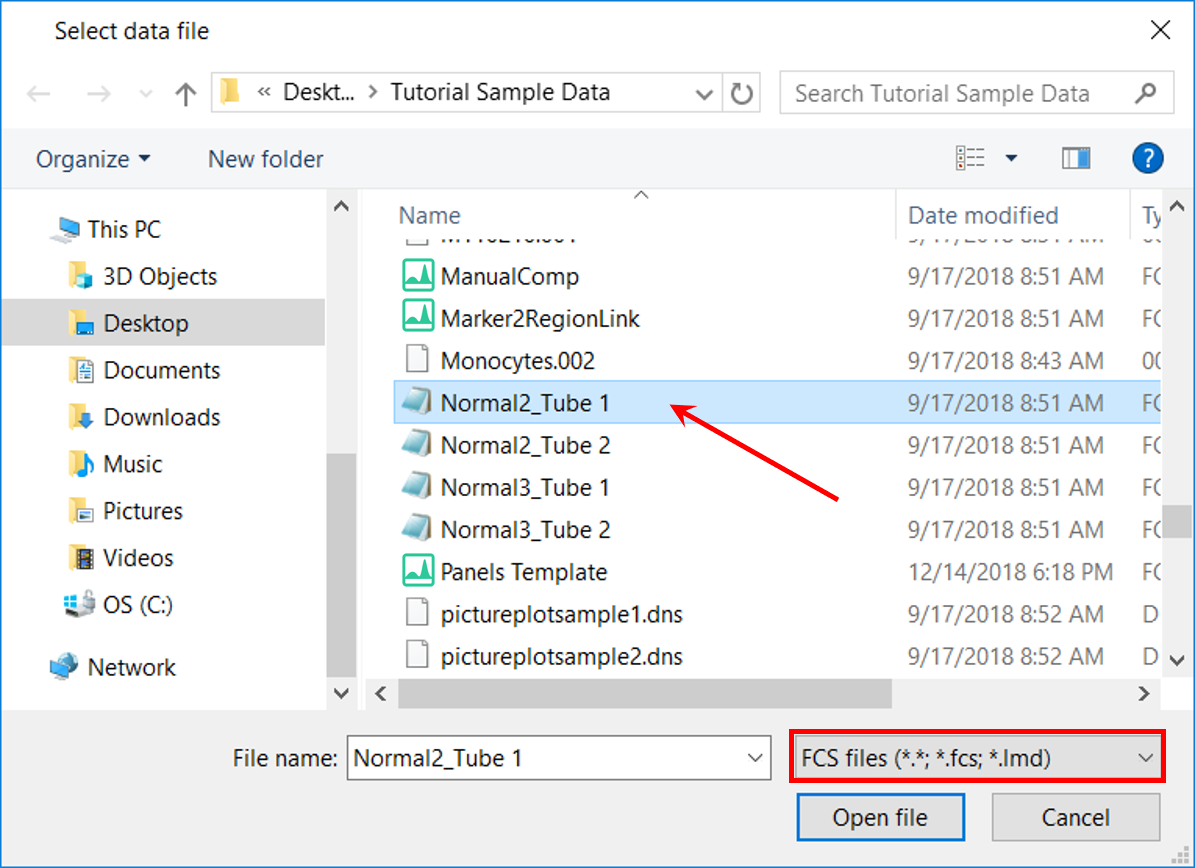
Figure T11.34 Selecting Data for the Data List with Panel On
6.Since the Panel created for this layout was defined as a two-tube panel, FCS Express will prompt you to whether or not you would also like to add the next tube to the Data List to complete the 2-tube panel, as seen in Figure T11.35. Click Yes.
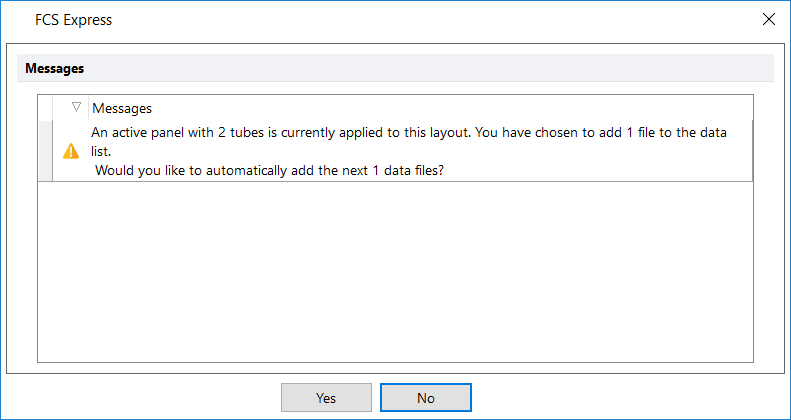
Figure T11.35 Prompt to Automatically Add Data File to Data List
7.FCS Express will load the 2 tubes, Normal2_Tube1 and Normal2_Tube2 into the Data List. FCS Express also automatically populates all the plots in the layout with the appropriate data files that were assigned to each plot during the creation of the layout, including the histogram that contains the overlay on Page 2.
8.To analyze another set of samples that fit the Panel criteria, click on the blue "+" icon in the Data List toolbar and choose Add Data File.
9.Navigate to the tutorial sample folder and, while holding the Cmd key, select files Normal3_Tube1 and Normal3_Tube2.
10. Because you have selected 2 tubes, FCS Express will not prompt whether you would like to automatically add the next data files to the Data List. The same would hold true if all four data files were selected initially for addition to the Data List. This also is true for any multiple of two, the number of tubes defined in the panel (i.e. six data files or 60 data files).
11. After adding the four data files, the Data List should resemble Figure T11.36.
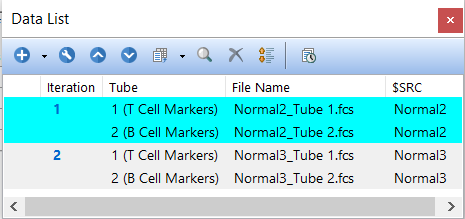
Figure T11.36 Data List Containing More Than One Iteration with Panel On
12.Keep the Data List open. Feel free to dock and pin the Data List. Later in this section, we will review how to rearrange data files within the Data List.
Advancing Through Panel Iterations in the Data List
13.To advance from one iteration to another iteration to be analyzed, click Data tab→Change Data On All Objects→Next command (Figure T11.37, red outline).

Figure T11.37 Change Data on All Objects Using Next from Ribbon
14.Alternatively, select the Iteration number from the drop down list under the Data tab, as seen in Figure T11.38.
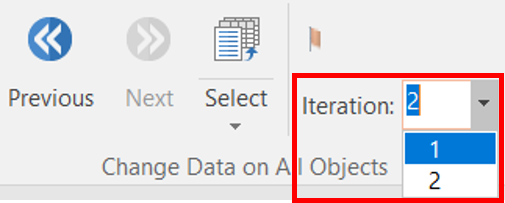
Figure T11.38 Navigating through Data Fiels by Using the Iteration Dropdown List from Data Tab on Ribbon
15.The number of iterations available will match the number of iterations seen in the Data List, as seen in Figure T11.36.
16. Another way to navigate through data files is by clicking the Iteration number within the Data List, as seen in Figure T11.39.
17.The iteration that is currently displayed within the plots of the layout will be highlighted in aqua within the Data List.
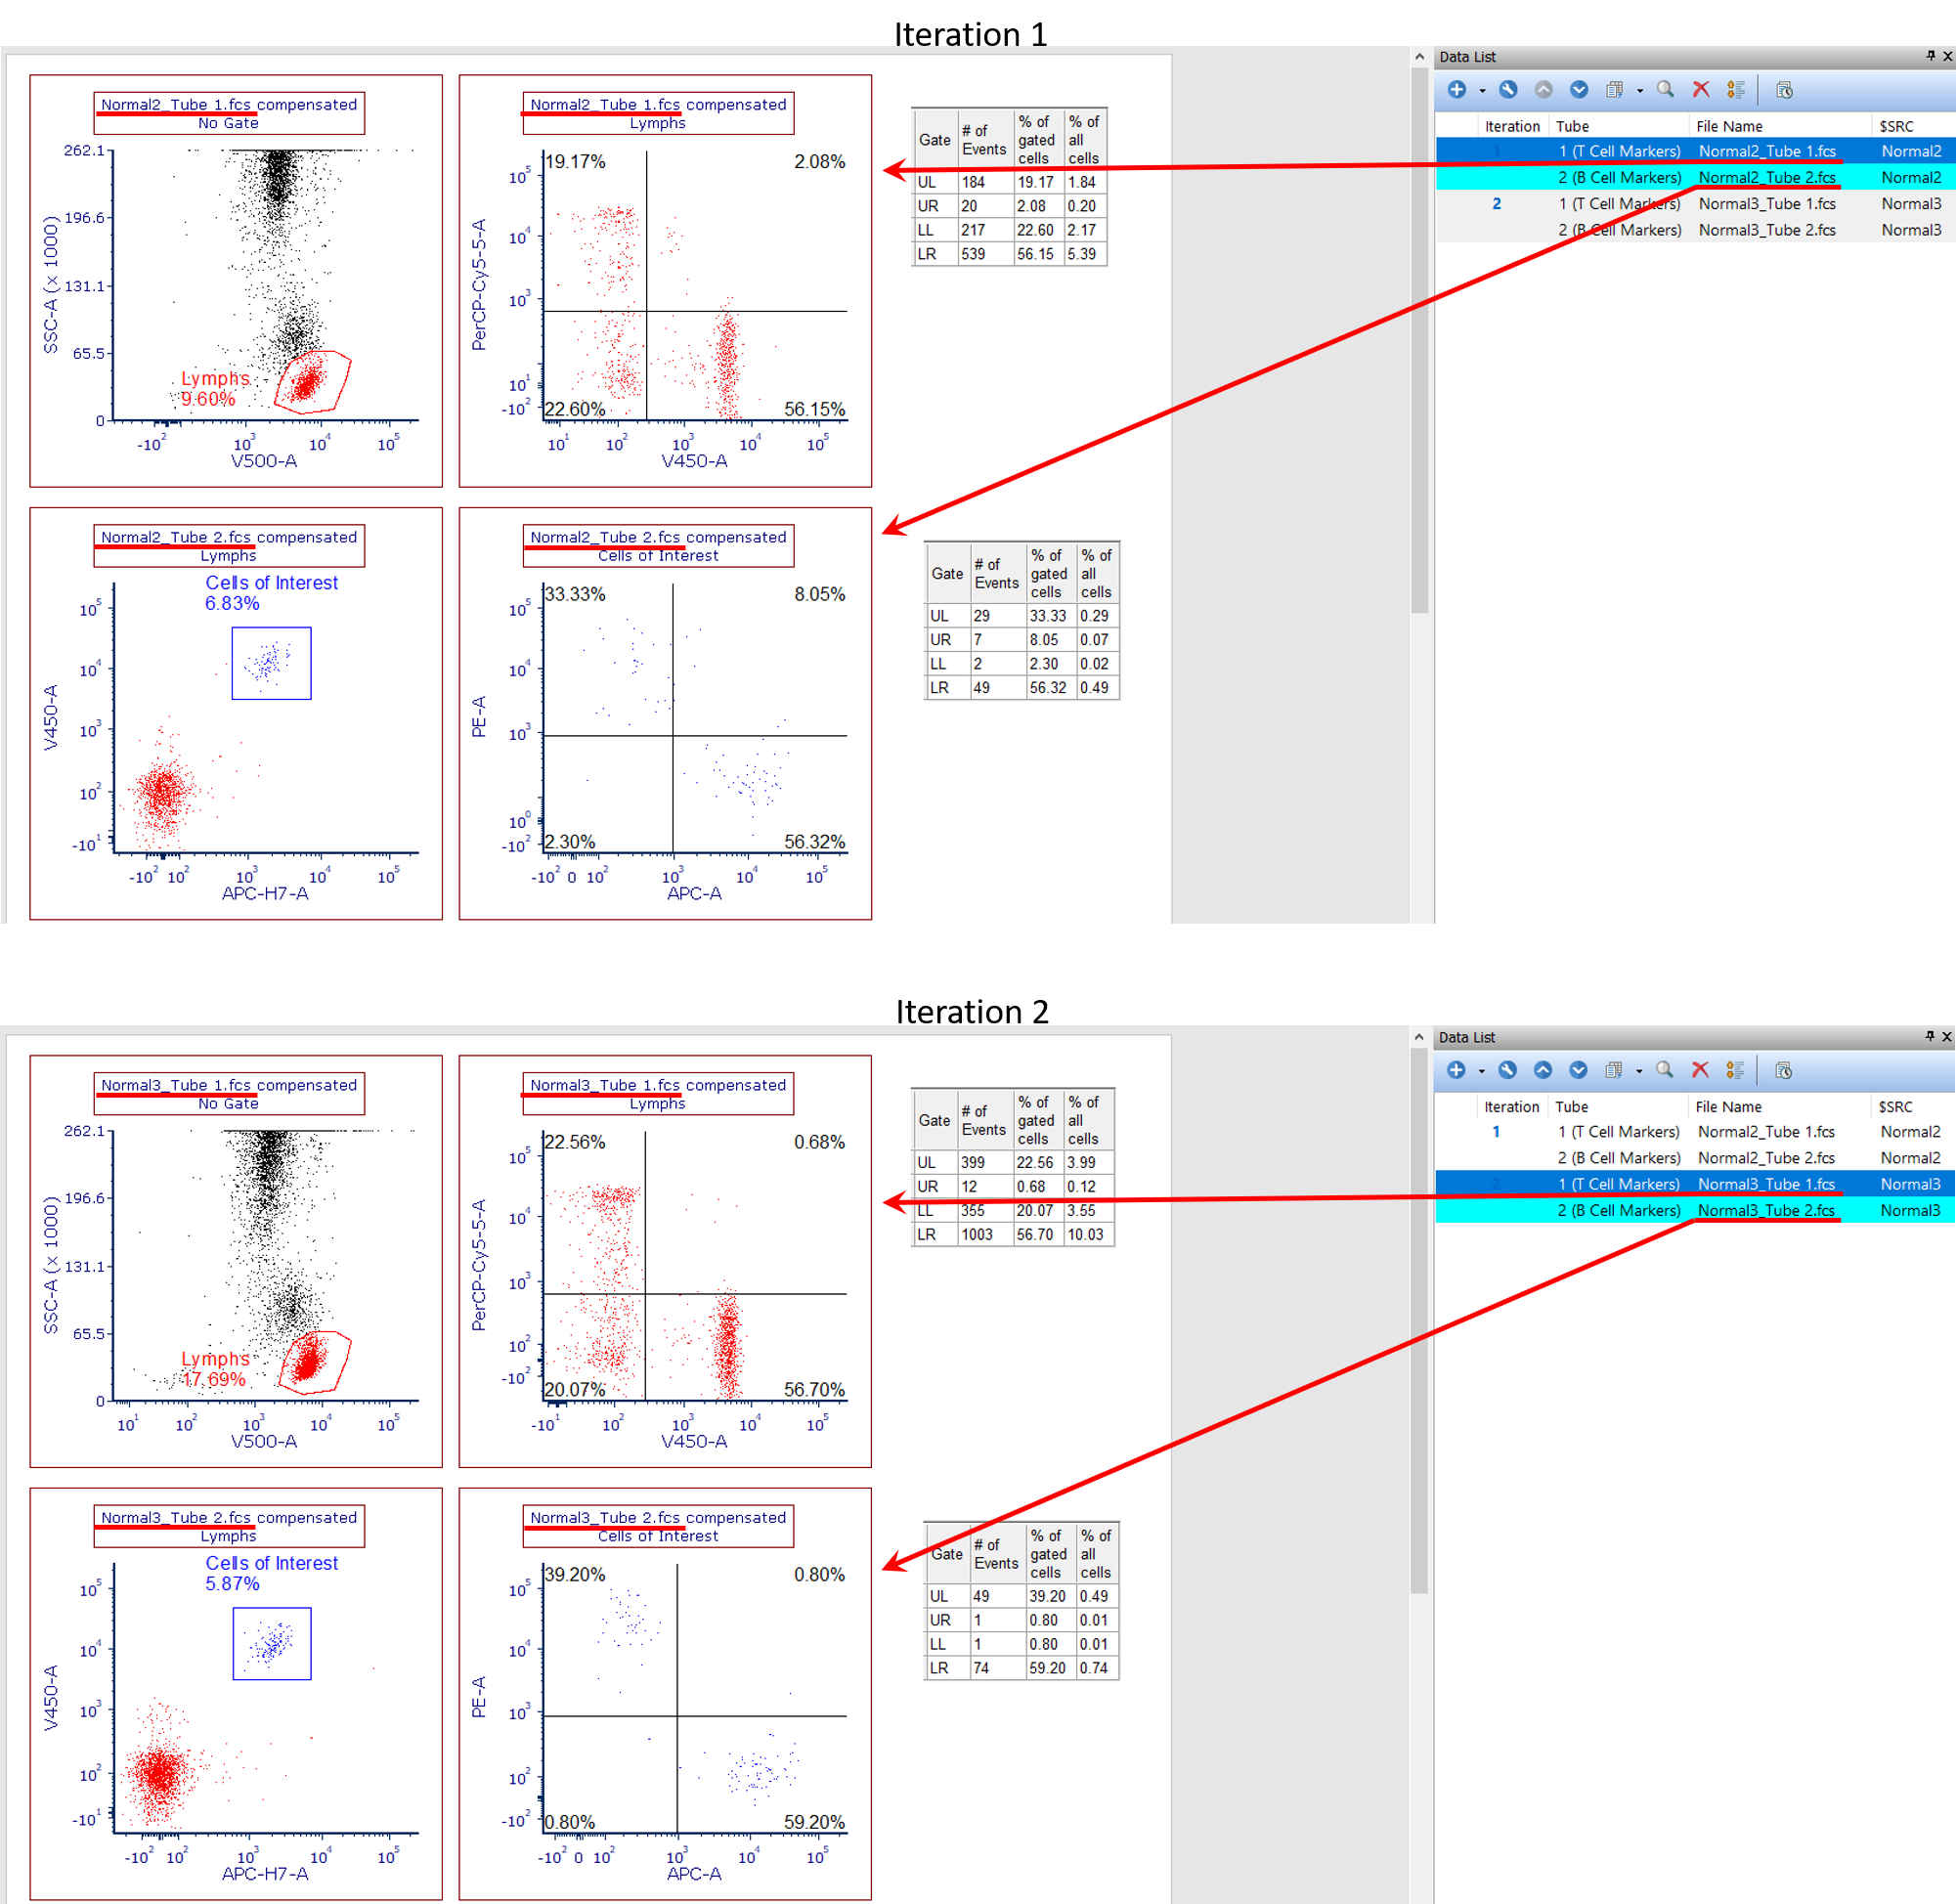
Figure T11.39 Displaying Different Iterations with Panel On
Rearranging Data Files within the Data List
18.Tubes must be loaded in the correct order for every iteration (or set of two files here). In this example, the first tube of each iteration must always be the data file for T Cell Markers, while the second must be B Cell Markers.
19.If data files are loaded in the incorrect order, the tubes can be moved up or down the Data List manually to reorder them properly. Click the File Name to select the file(s); then, click the Up or Down arrow within the Data List toolbar until the iteration is in proper order.
20.In Figure T11.40, the tubes of the first iteration are in the wrong order. As a result, incorrect data is being displayed in the incorrect plots.
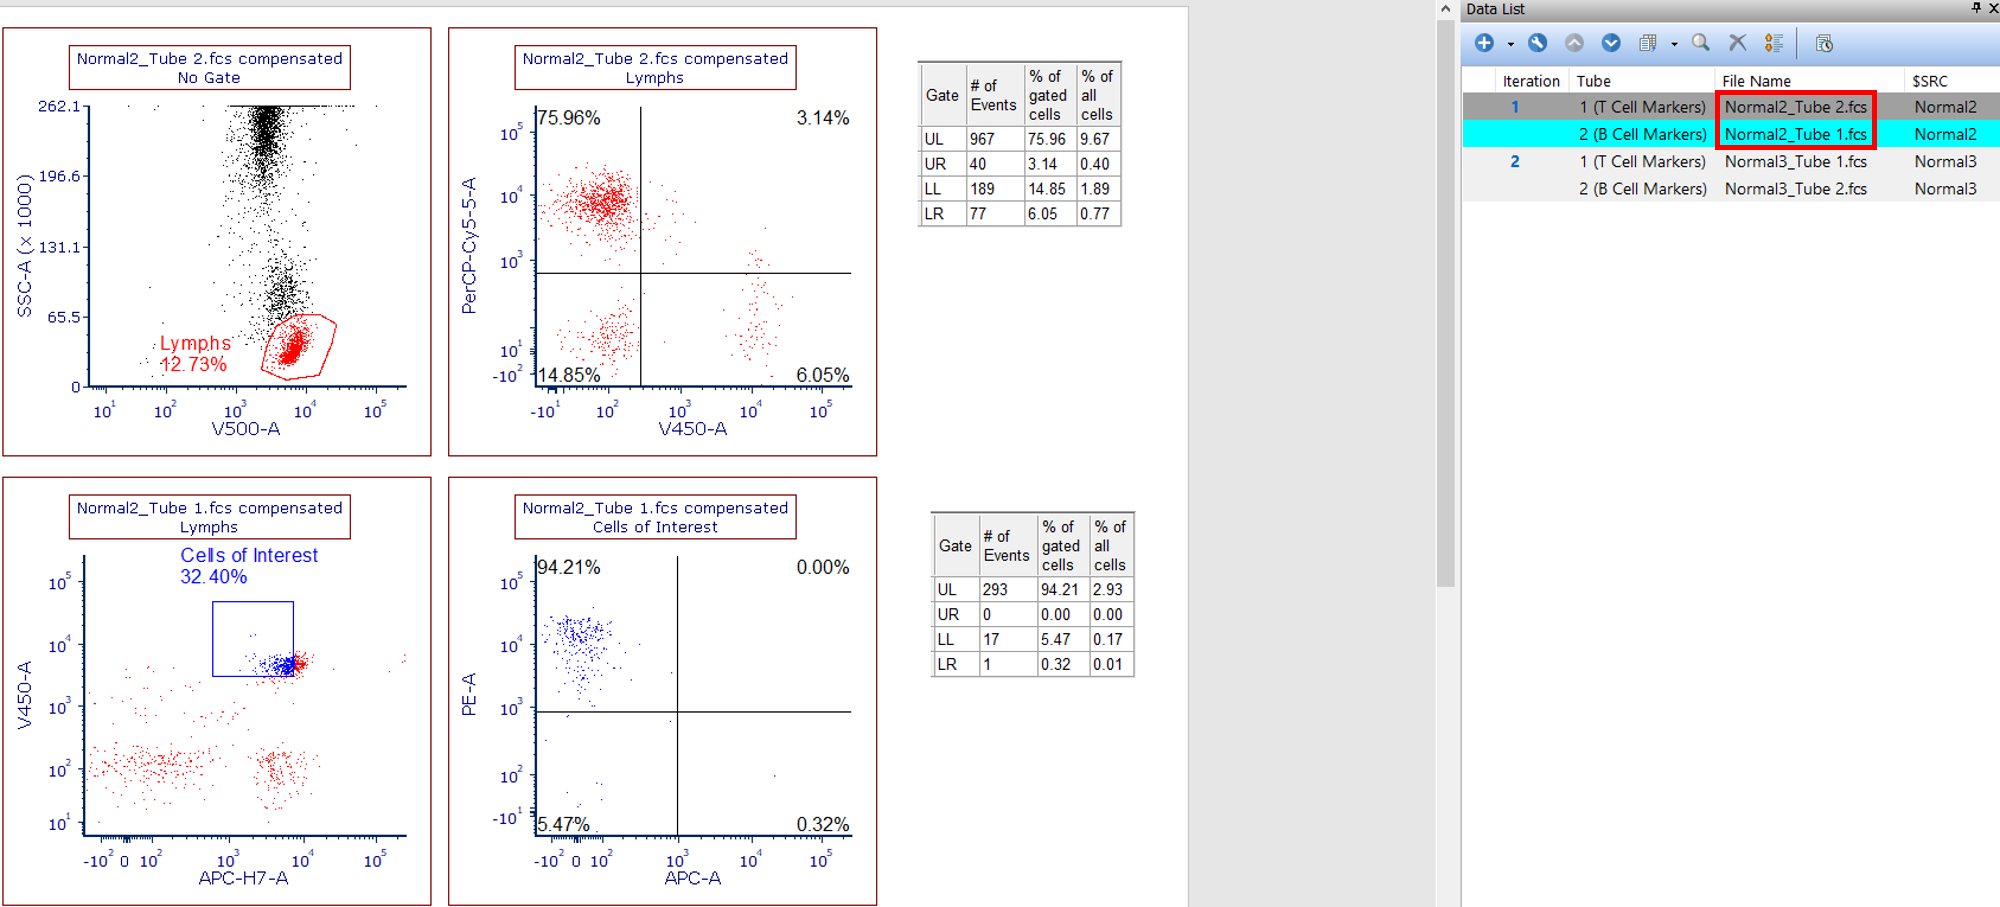
Figure T11.40 Incorrect Order Of Tubes Within the Data List - Tube 2 is Before Tube 1.
By selecting a tube in the first iteration and using the Up or Down arrow from the Data List toolbar, we can correct the ordering. (Figure T11.41). While reordering the tubes in the Data List, the data displayed in the plots and objects will refresh and statistics will be recalculated automatically.
21. Click the File Name (Figure T11.41, ![]() ).
).
22. Click Up arrow in Data List toolbar (Figure T11.41, ![]() ).
).
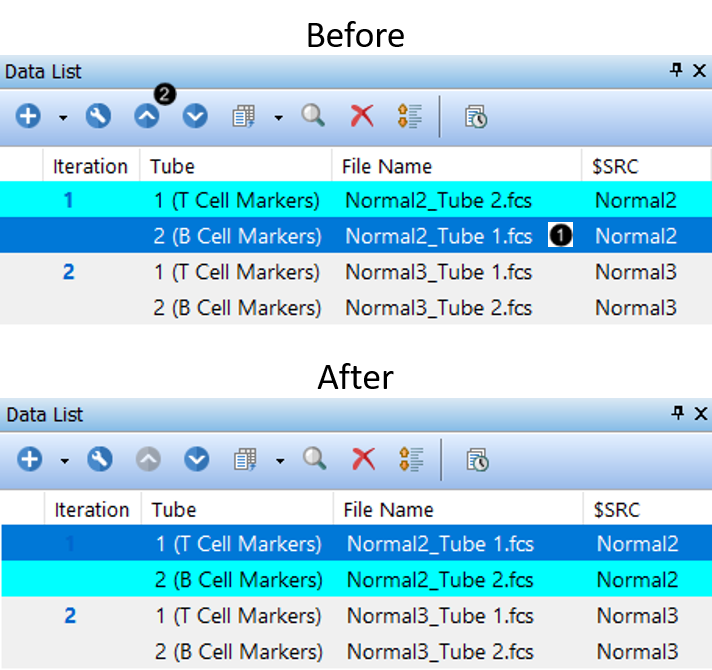
Figure T11.41 Correcting Tube Order in Data List
However, if the files are large, there may be a noticeable delay in the refresh time as the tubes are moved within the Data List. Users can defer the layout changes by selecting the Defer Layout Changes button ![]() in the Data List toolbar.
in the Data List toolbar.
23. To defer the changes while reordering data files, click Defer Layout Changes button (Figure T11.42, ![]() ).
).
24.Select the file to be moved (Figure T11.42, ![]() ).
).
25.Click the Up or Down arrow (Figure T11.42, ![]() ).
).
26. To apply changes, click the blue play icon ![]() (Figure T11.42,
(Figure T11.42, ![]() ).
).
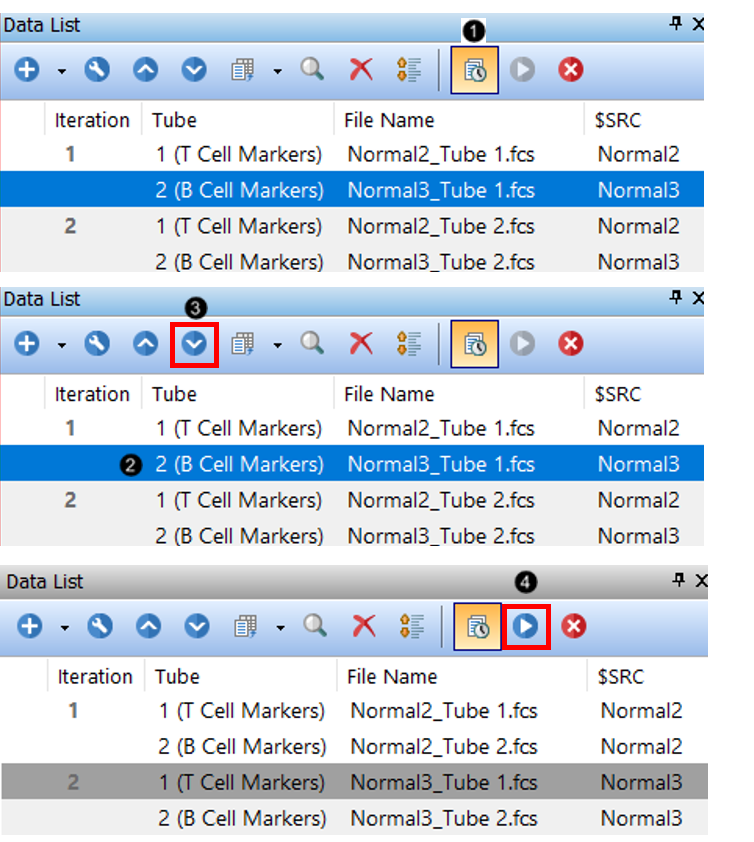
Figure T11.42 Deferring Layout Changes - Before and After
Adding plots to the layout
27.After a Panel has been added to a layout, the layout can be edited easily.
28.On Page 1, click to select the following plots while holding the Cmd key:
a.V450 vs PerCP Cy5.5
b.APC-H7 vs V450
c.APC vs PE
29.Right-click the selected plots and click Copy. Also, the keyboard shortcut Cmd+C will work.
30.Go to Page 2. Right-click the page and click Paste. Also, the keyboard shortcut Cmd+V will work.
31.Rearrange the plots around the 1D histogram with the overlay.
32.Change the parameters for these pasted plots if interested.
33.Add a Quadrant to the plot that was previously the APC-H7 vs V450 plot.
34.Save your layout by clicking File tab→Save command or by clicking the Save button ![]() in the layout toolbar at the top of your computer screen.
in the layout toolbar at the top of your computer screen.
Finally, we will see examples of saving and loading panels.
