Visualized Mixing Matrix
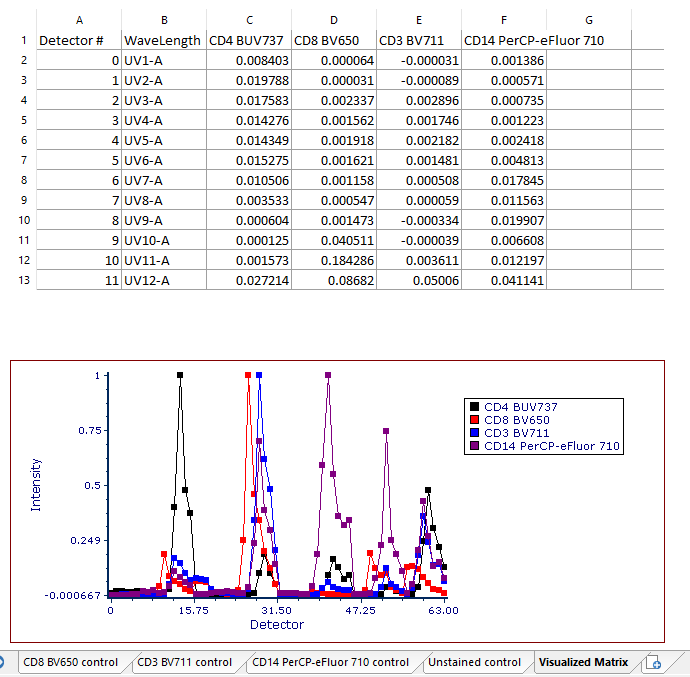
The Visualized Matrix page depicts a chart displaying the Detector vs Normalized Intensity for each stained control added in the wizard, as well as a spreadsheet with the charted values (each detector is labeled by Detector # and Wavelength). See Figure 9.48.

Figure 9.48 Visualized Matrix page automatically created upon completion of the Automatic Unmixing Setup.
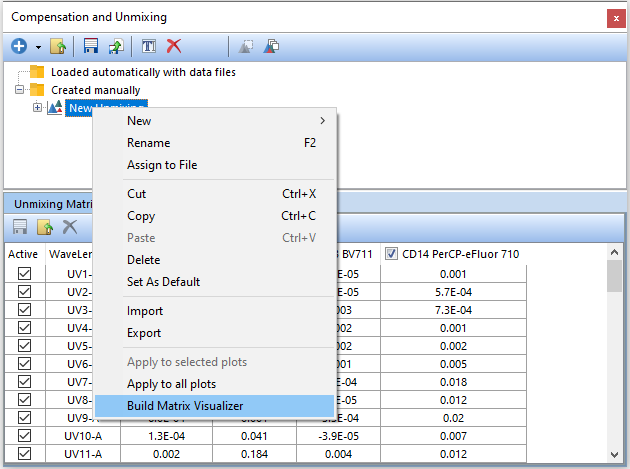
The Visualized Mixing Matrix page can also be created manually for any unmixing matrix added to the layout. To create the Visualized Matrix page, after creating an unmixing or importing an unmixing matrix into the layout, simply right-click on the desired unmixing matrix in the Compensation and Unmixing editor and select Build Visualized Matrix (Figure 9.49). FCS Express will automatically generate a Visualized Matrix page on the layout when clicked.

Figure 9.49 To manually create the Visualized Matrix page, right-click the desired unmixing matrix and select Build Matrix Visualizer.
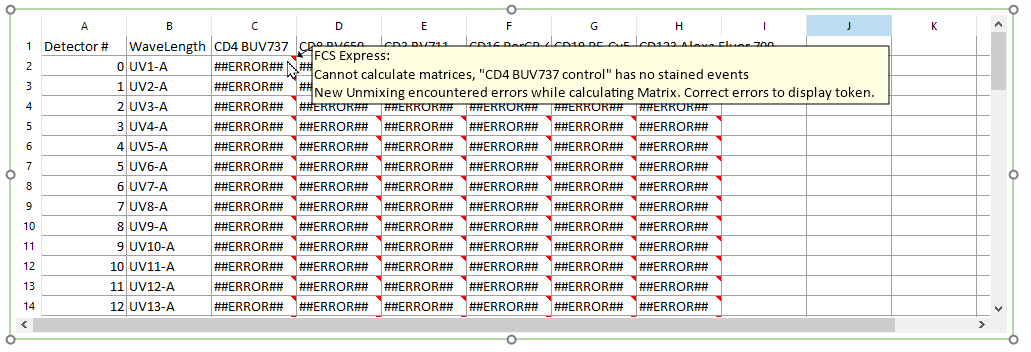
In case any error impedes the calculation or the display of the Matrix Visualizer, the spreadsheet containing the values to plot will report the error accordingly. Hovering the mouse on the spreadsheet cell reporting the error, will open a hover-hint with additional details on the source of the error. An example of a hover-hint is depicted in Figure 9.50 below when the error was caused by the lack of stained events in one of the controls.

Figure 9.50 An example of Matrix Visualizer with errors.
