Applying a tSNE transformation
Once a tSNE transformation has been defined, it may be applied to any plot in FCS Express. Once a tSNE transformation is applied to a plot, standard gating and statistics may be used to study the result of the tSNE transformation.
Note: When a tSNE transformation has been applied, the text "tSNE mapped" will appear in the plot title.
tSNE transformations may be applied to 1D and 2D plots by any of the following methods:
•Drag and drop the tSNE from the Transformation window to the intended plot or data grid (Figure 9.143).

Figure 9.142 Applying a tSNE transformation to a plot by dragging the tSNE transformation from the Trasnformations navigator to the plot (green arrow).
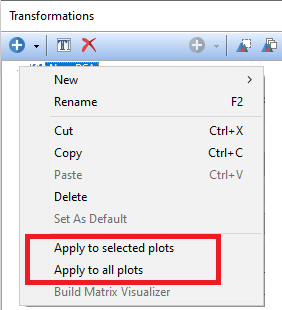
•tSNE may be applied to individual or multiple plots by performing either option outlined in red in the Transformations window below (Figure 9.144).

Figure 9.143 Commands to Apply Transformation to Plot(s)
•Right-click the name of tSNE in the Transformations window and click Apply to selected plot or Apply to all plots button in pop up menu (Figure 9.145).

Figure 9.144 Commands to Apply Transformation to Plot(s)
•Access the Overlays formatting dialog and choose the tSNE transformation to apply from the Transformation drop down menu (Figure 9.146).

Figure 9.145 Applying a tSNE transformation to a plot by selecting the tSNE transformation from the Formatting Overlays dialog in the Transformation dropdown.
The result of both methods will be plots that denote they are tSNE mapped in the plot title (Figure 9.147). To access the tSNE parameters click and hold on the axis of the plot and choose the appropriate tSNE X or Y parameters.

Figure 9.146 2D and 1D plot with tSNE transformation applied. Note the "tSNE mapped" suffix in the plot title.
In the next section, we will see how to work with tSNE parameters.
