Working with Regression Tokens and Fit Equations
To learn working with regression we will pick up from where we left off in the previous section of this tutorial.
If you did not complete the previous section, you may begun this section by opening the FITC MESF Beads - Part2.fey layout stored in the Calculating MESF From Regression folder of the Tutorial Sample Data archive.
As a first step, we will display a regression token on the Scatter with Regression Plot.
1.Right-click the Scatter with Regression plot and select Text Boxes→Add Text Box from the right-click menu. A text box will be created within the plot.
2.Right-click inside the text box on the plot and select Insert Token from the right-click menu (Figure T18.11a, ![]() ).
).
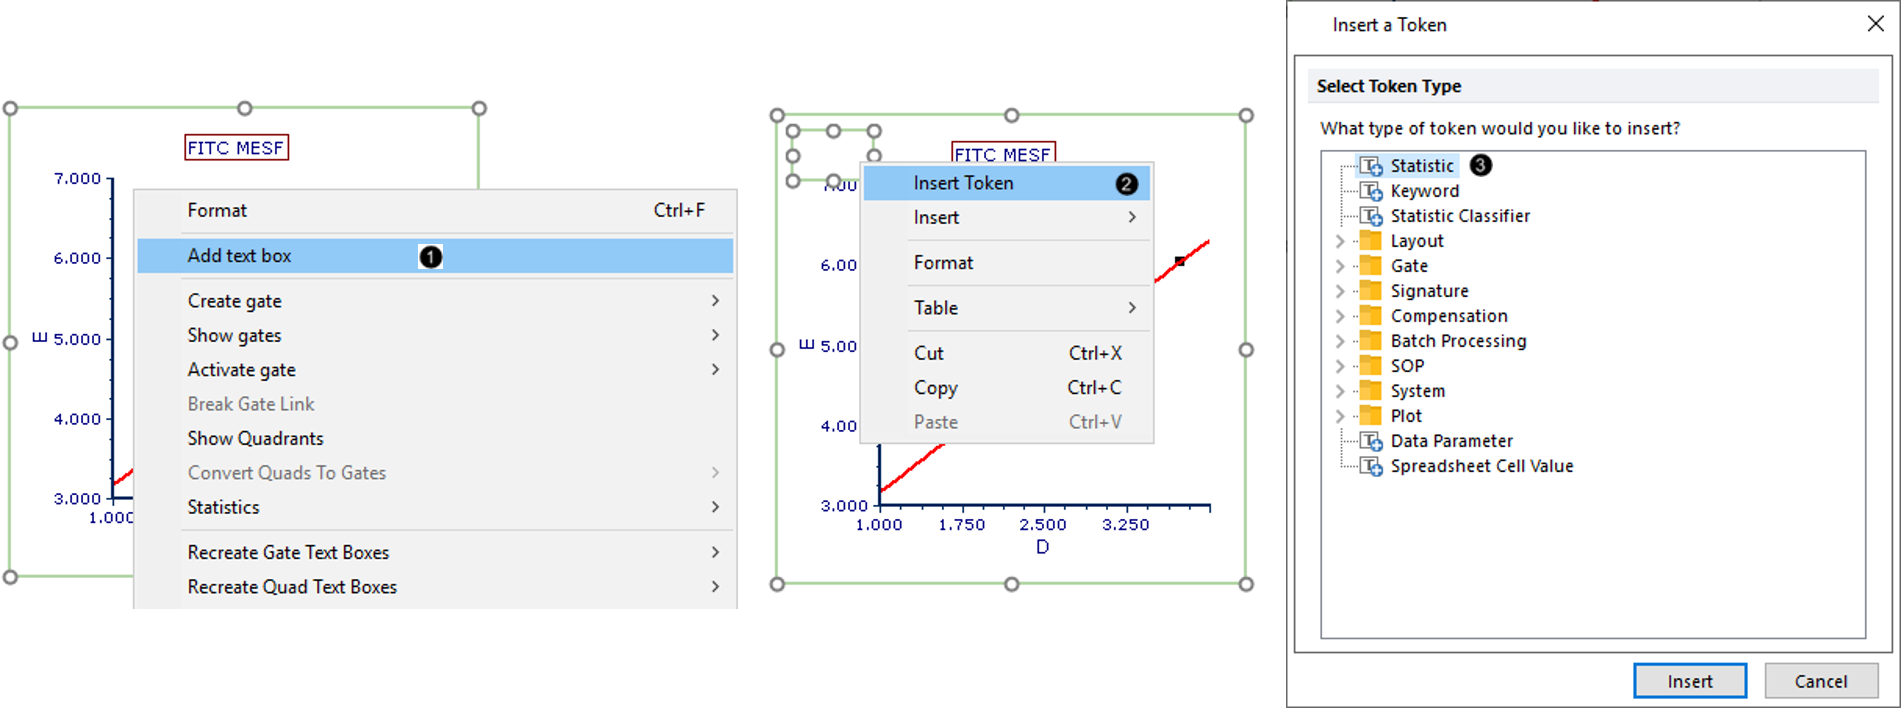
Figure T18.11a Adding a Text Box to a Plot and Inserting a Token
3.Double-click Statistic in the Insert a Token dialog (Figure T18.11b). The Create Statistic dialog will open.
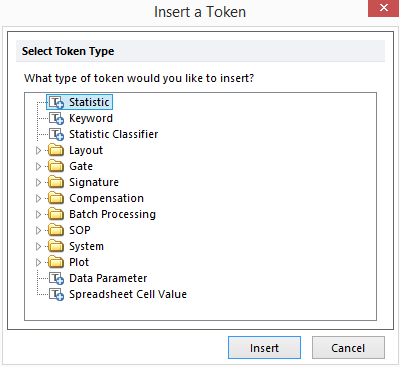
Figure T18.11b The Insert a Token dialog.
4.In the Create Statistic dialog, click the Statistic category (Figure T18.12, ![]() ).
).
5.Select Regression Parameter Statistics from the Select a Statistic drop-down list (Figure T18.12, ![]() ).
).
6.Select m (slope) from the Statistic list (Figure T18.12, ![]() ).
).
7.Click OK (Figure T18.12, ![]() ). The slope, m, of the regression curve now is displayed on the plot.
). The slope, m, of the regression curve now is displayed on the plot.
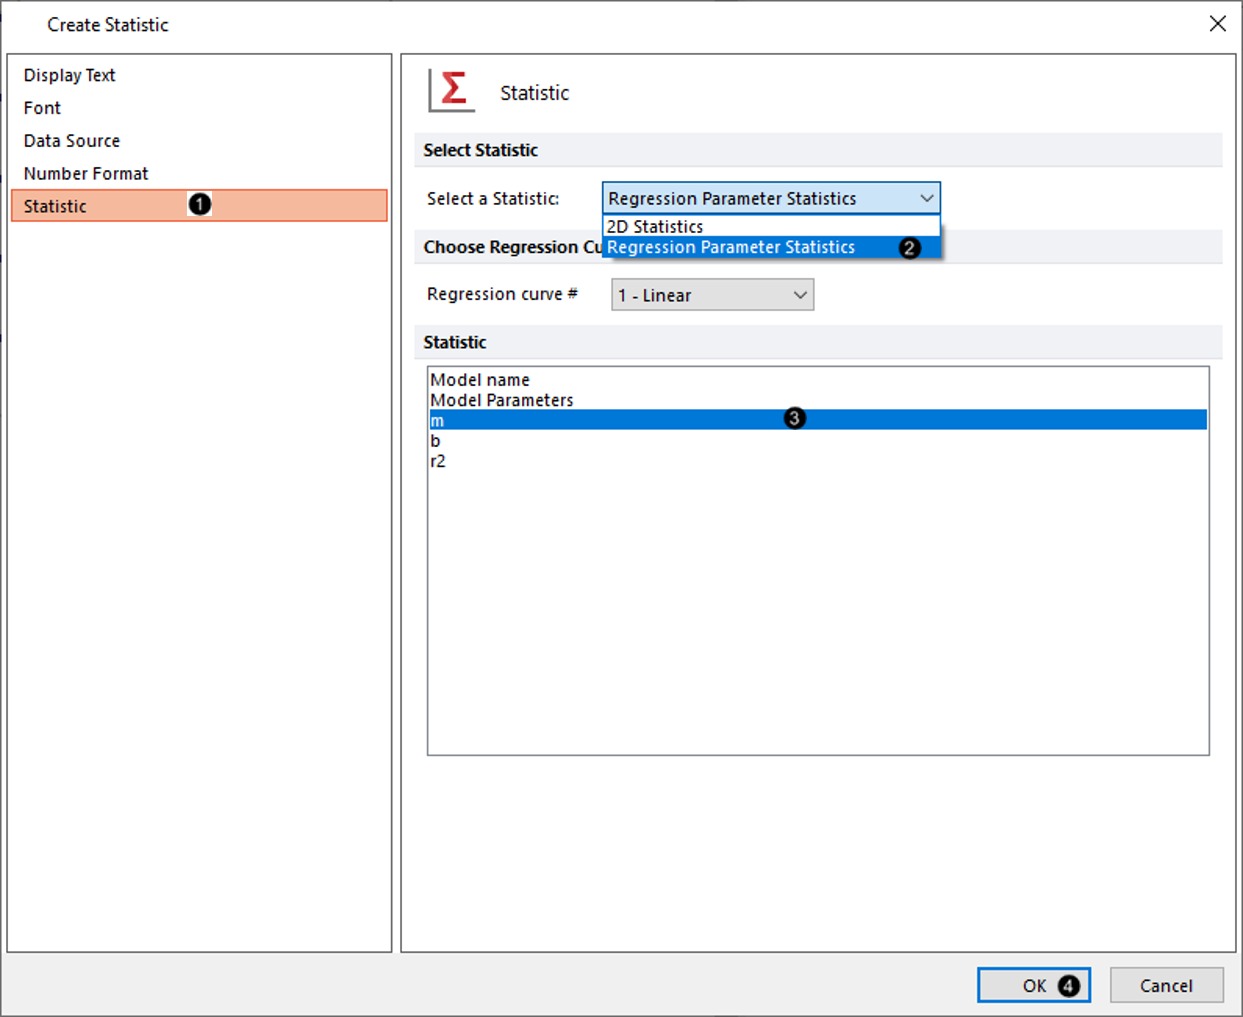
Figure T18.12 Adding Slope of Linear Regression
8.Click inside the text box to put it into edit mode. The border will be green.
9. Use the arrow keys on the keyboard, or click within the text box to move the cursor to the left of the token.
10. Type "m = " (Figure T18.13). The token has now been annotated with this descriptive freetext within the text box. Note: if necessary, the text box can be enlarged by dragging its border's anchors, so all the text fits on one line and repositioned by dragging its border to better resemble the figure.
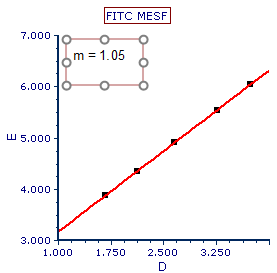
Figure T18.13 Scatter with Regression Plot Displaying Slope of Linear Regression, m
We now will create a Custom Token for the linear regression equation, so we can apply it to other .fcs files, including those in other layouts. Each token in the Regression Parameter Statistics list (Figure T18.12 above) will be used as a component of this Custom Token.
11. Open the Custom Token window by clicking on View tab→Token group→Custom Tokens command ![]() . In the Custom Tokens window will open.
. In the Custom Tokens window will open.
12. In the Custom Tokens window, click the blue plus button ![]() to create a new custom token.
to create a new custom token.
13. Rename the "New Custom Token" to "LinFitLogMedMESF" (Figure T18.14, ![]() ).
).
14. Type "m=,b=,r2=" in the formula (lower) pane of the Custom Tokens window (Figure T18.14, ![]() ).
).
15. Click the Scatter with Regression plot, so its border becomes highlighted.
16. Drag and drop the border of the Scatter with Regression plot to the position after the "m=" and before the "," (comma) in the formula pane of the Custom Tokens window (Figure T18.14, ![]() ).
).
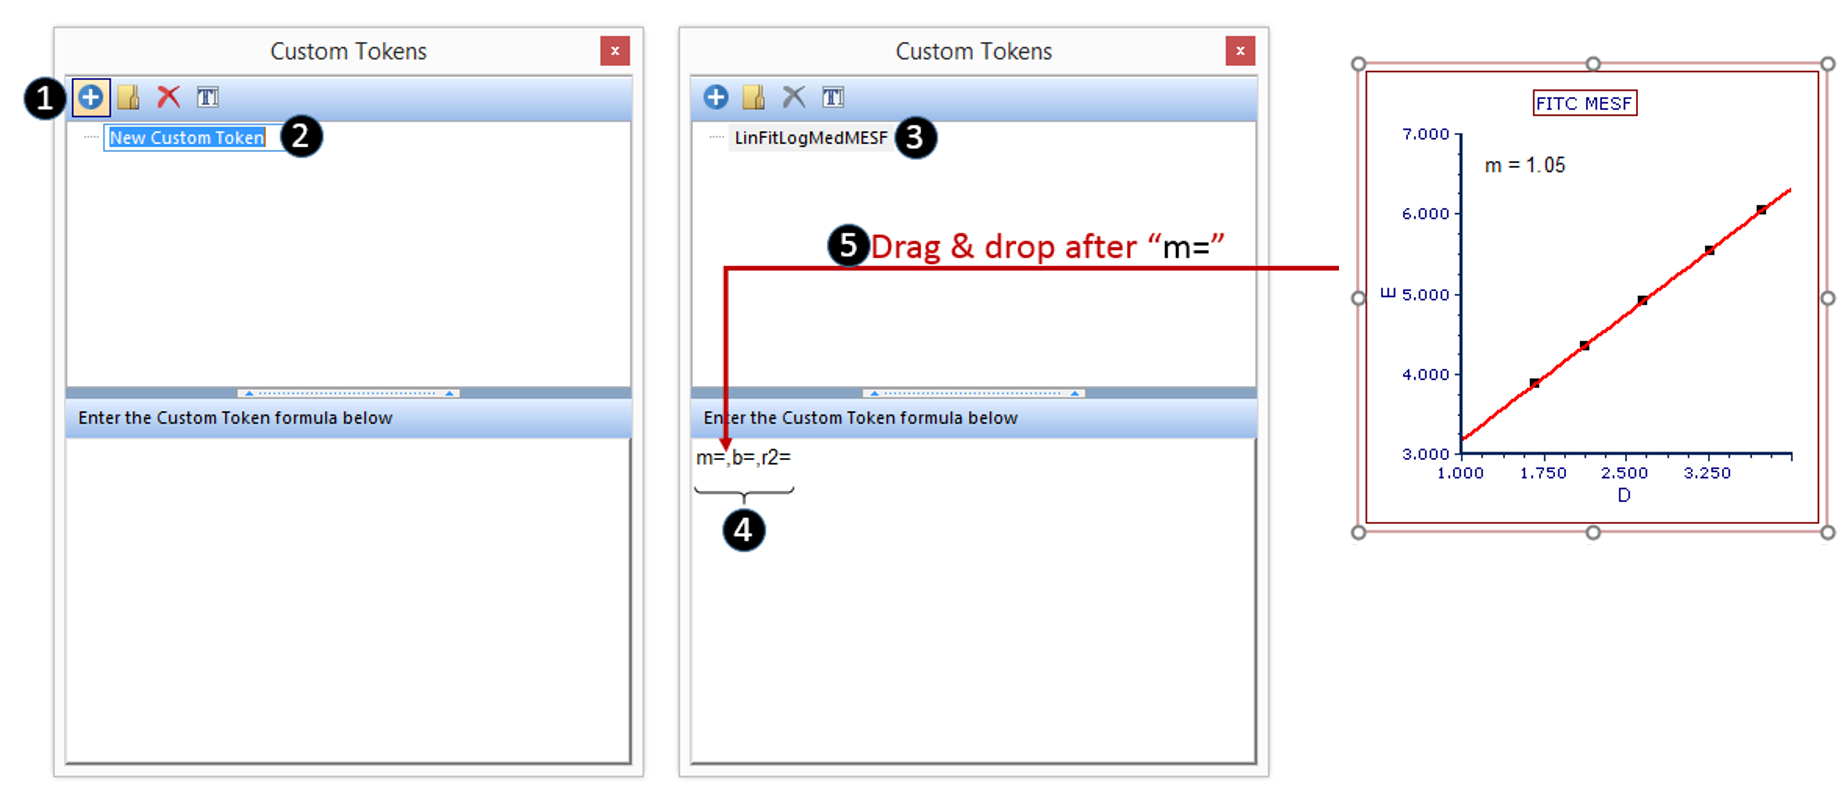
Figure T18.14 Creating Custom Token for Linear Regression Fit Parameters
17. Double-click Statistic token from the Paste Special dialog (Figure T18.15a).
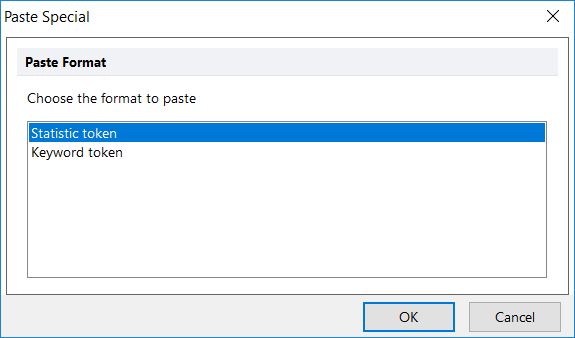
Figure T18.15a The Paste Special dialog.
18. Choose Regression Parameter Statistics from the Select a Statistic drop down menu (Figure T18.15, ![]() ).
).
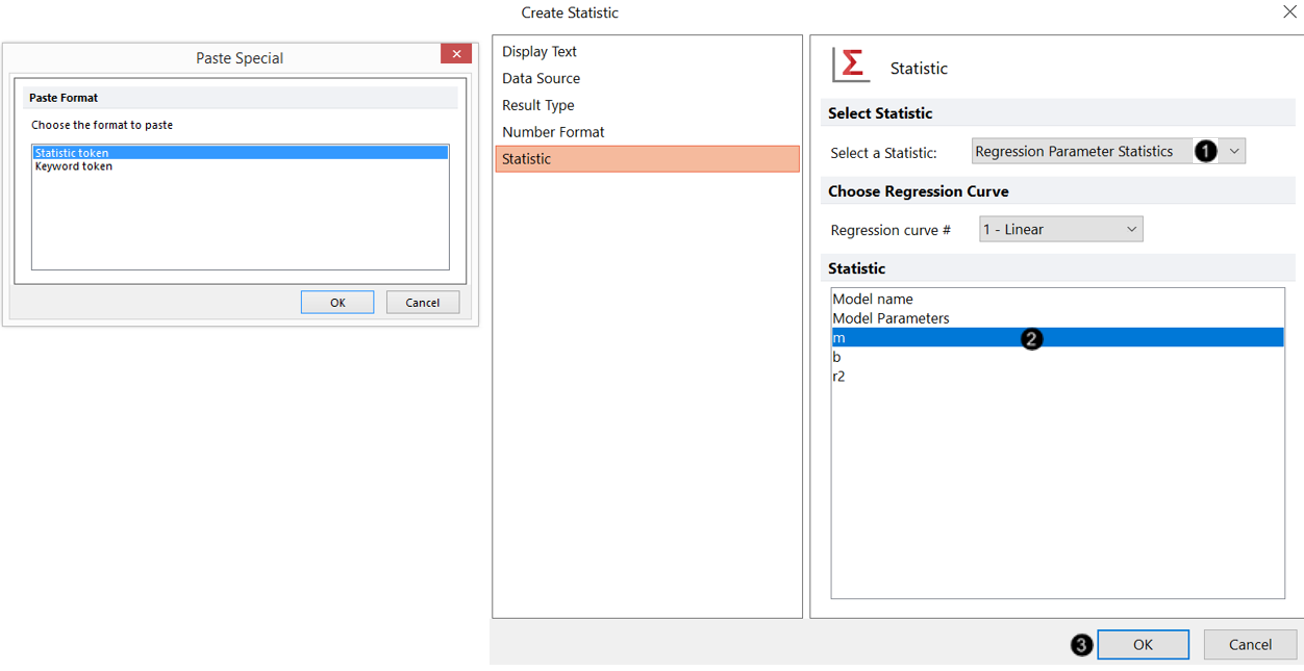
Figure 18.15 Inserting a Regression Parameter Token as a Component of the Linear Regression Fit Custom Token
19. Choose m from the Statistic list (Figure T18.15, ![]() ).
).
20. Click OK (Figure T18.15, ![]() ).
).
21. Repeat Steps 17-21, with the following modifications:
•Step 17: Drop the plot after the "b=" in the formula pane of the Custom Tokens window
•Step 20: Choose b from the Statistic list
22. Repeat Steps 17-21, with the following modifications:
•Step 17: Drop the plot after the "r2=" in the formula pane of the Custom Tokens window
•Step 20: Choose r2 from the Statistic list
23. Drag the LinFitLogMedMESF Custom Token from the Custom Token window onto a blank area of the layout. A new text box containing the linear regression fit token will be automatically created.
Note: an r2 value of exactly 1 denotes a perfect fit, which is rarely attained with experimental data. The Custom Token initially displays a value of 1.00 for r2 because its value here is greater than 0.995, and statistics in FCS Express are rounded to two decimal places by default.
We will now edit the r2 component of the Custom Token to display five digits after the decimal point.
24. Double-click the component r2 token in formula pane of the Custom Tokens window.
25. Click the Number Format category in the Edit Statistic dialog (Figure T18.16).
26.Increase the Number of decimals to 5 (Figure T18.16).
27.Click OK.
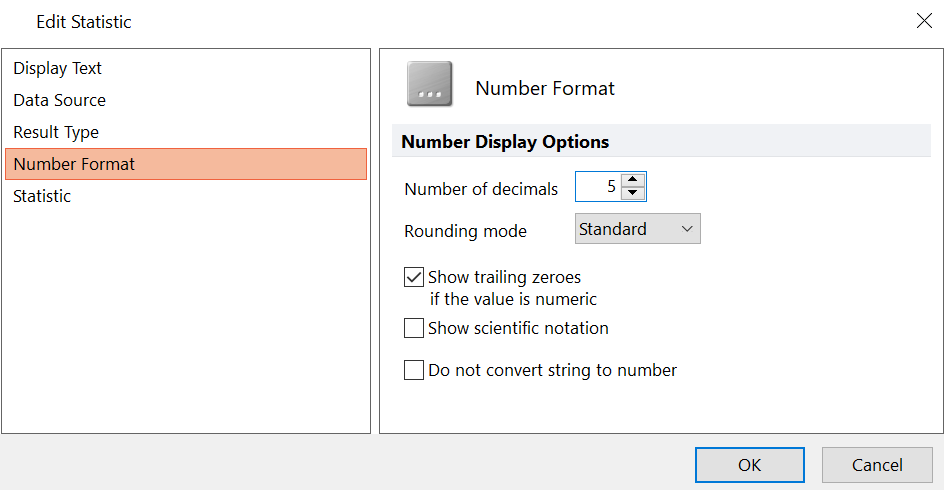
Figure T18.16 Increasing the Number of Decimal Places for R-Squared Component of Linear Regression Fit
The linear fit token will be displayed as in Figure T18.17.

Figure T18.17 LinFitLogMedMESF Custom Token Displayed in a Text Box after Editing Number of Decimals for R-Squared Component
Once a linear regression is calculated it can be used as model for fitting unknown samples. This can be done directly within the same layout in which the regression has been calculated (see the Apply Regression to an FCS File section of this tutorial) or in any new layout. To use the regression in a new layout see the Save a Regression topic of this tutorial.
