Insert and Format Picture Plots
In the course of this section, you will learn how to:
•Define settings for viewing picture plots
•Choose the channel to display
•Create multi-channel overlays to create a merged image
Note: In this section we will be using files ending in the .dns file format in a new layout. Picture plots may be inserted using a variety of file formats depending on your analysis instrument and export format.
1.Click File tab→New→New.
2.Choose the Data tab→Organize Data Sets group→Data List command ![]() . A Data List window will appear (Figure T10.3).
. A Data List window will appear (Figure T10.3).
3.Click the blue plus to add files ![]() and choose Add Data File.
and choose Add Data File.
4.Choose DNS data Stream files (*.dns) from the Files of type: drop-down list.
5.Navigate to the FCS Express Tutorial Sample Data archive.
6.Select pictureplotsample1.dns and pictureplotsample2.dns and click Open to load them into the Data List.
Now, the Data List should resemble Figure T29.1.
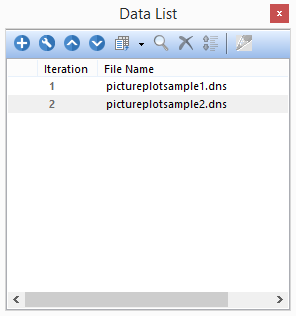
Figure T29.1 Data List after Loading File
5.Drag and drop pictureplotsample1.dns by its file name from the Data List to the blank, white space of the layout.
6.Select Picture Plot in the Select Plot Types... dialog and uncheck any other boxes (Figure T29.2).
7.Click OK.
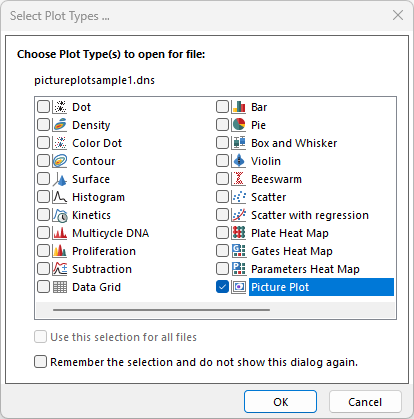
Figure T29.2 Choosing to Insert a Picture Plot
A Picture Plot will appear in the layout as in Figure T29.3.
We will now change the view background options to display only the masks for the individual cells and not the background.
Note: The labels on the axes reflect the pixel coordinates. You can turn these off by changing the axis formatting options.
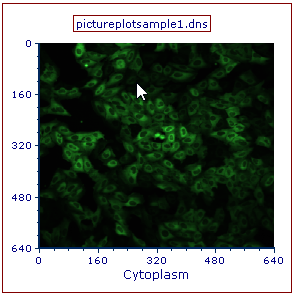
Figure T29.3 Picture Plot for pictureplotsample1.dns Inserted in the Layout
8. Double-click the picture plot. The Formatting dialog will appear, docked to the right side of layout.
9. Choose the Overlays category.
10. Uncheck Show Background Image (Figure T29.4, red outline).
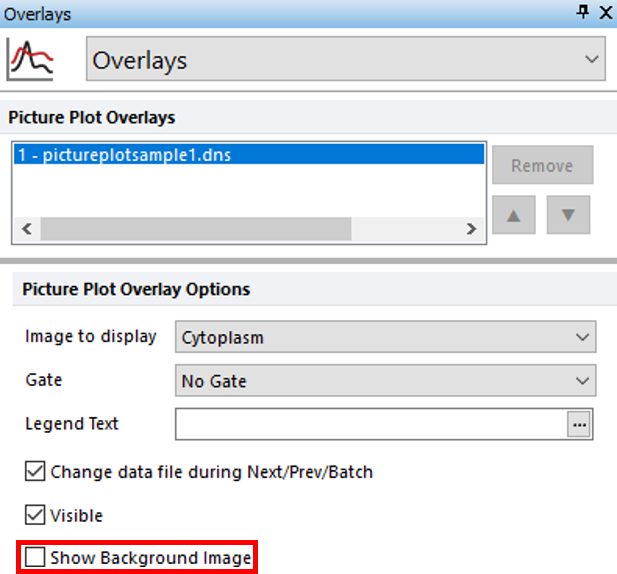
Figure T29.4 Deselecting the Show Background Images Option
Notice how the black background has been removed and only individual cells are now displayed (Figure T29.5).
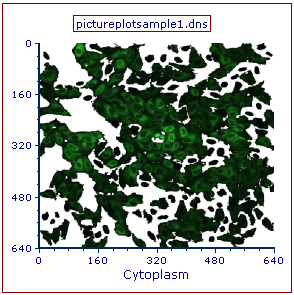
Figure T29.5 Picture Plot after Removing the Background Image
We now will look at the other channel associated with the image and create a two channel merged image.
11. In the Formatting dialog, check the box next to Show Background Image under the Overlays category.
12. Click picture plot to select it and key CTRL+D to duplicate plot. Note you may use copy and paste commands to create second picture plot.
13. Click and drag duplicated plot by the red outline to position it to the right of the first picture plot.
14. Click the x-axis label of the new picture plot (Figure T29.6).
15. Choose DNA to view the image of the DNA channel (Figure T29.5, blue highlighted text).
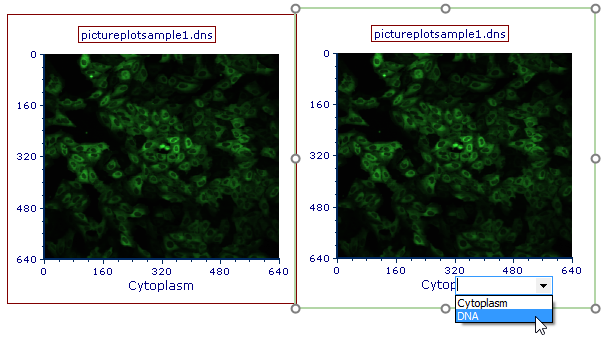
Figure T29.6 Selecting DNA Channel
The picture plot will resemble Figure T29.7, displaying the DNA image associated with the picture plot.
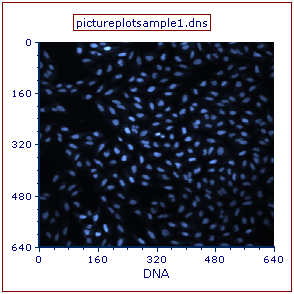
Figure T29.7 DNA Channel Displayed in Second Picture Plot
16. Drag and drop the right picture plot displaying the DNA channel by its outline to the left picture plot displaying the Cytoplasm channel after it is outlined in blue (Figure T29.8).
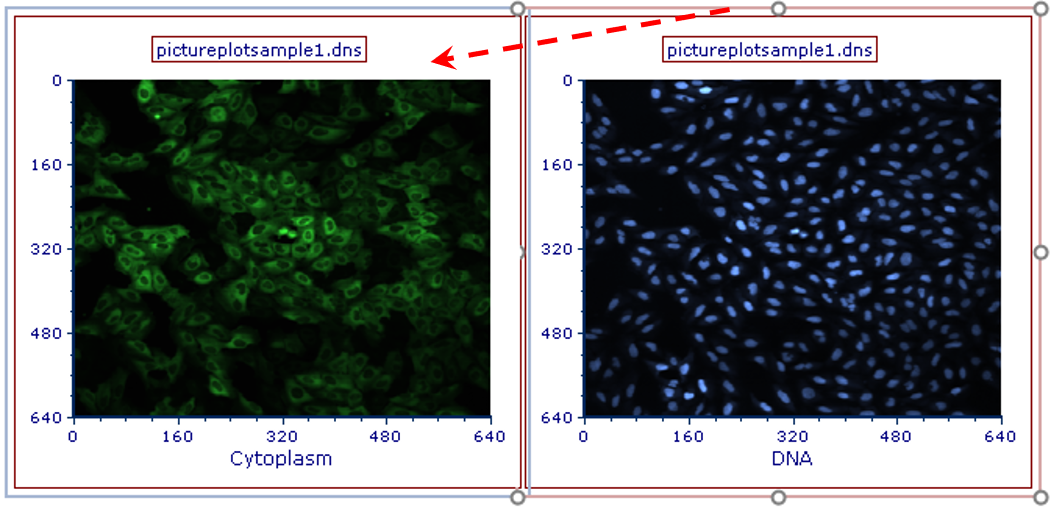
Figure T29.8 Dragging and Dropping Right Picture Plot on Left Picture Plot
17.Double-click the 2D Plot Overlay(s) option from the Paste Special dialog.
The left picture plot should resemble Figure T29.9, displaying both Cytoplasm and DNA channels as a merged image.
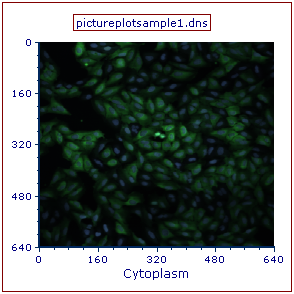
Figure T29.9 Picture Plot Overlay Displaying the Cytoplasmic and DNA Channels as a Merged Image
Data files in the Data List may be iterated through the picture plots.
19. Select the newly overlaid picture plot by clicking on it.
20. Choose the Data tab→Change Data on Selection group→Next command (Figure T29.10).

Figure T29.10 Next on Selection Command
Note: The picture plot will change to display the next file in the Data List. FCS Express can handle color and greyscale images, as seen with the greyscale images associated the pictureplotsample2.dns).
In the next section, we will learn about gating with picture plots.
