Token Multiplication Grouping
When extracting statistic(s) from a single gate, typically performed through a drag and drop or Insert Token operation, FCS Express arranges the output based on the order the statistics appear in the Create Statistic window. However, when working with multiple samples and selecting multiple statistics from multiple gates/quadrants/markers, the ordering of the output becomes important and it is often useful to define how the output will be grouped and displayed. In FCS Express, you can define how to group your statistics with the Token Multiplication Grouping feature.
Token Multiplication Grouping allows users to simultaneously extract and group multiple statistics from multiple gates/quadrants/markers/parameters based on a defined grouping priority. This feature is particularly helpful for inserting multiple statistics from multiple samples into a spreadsheet or text box, as it allows users to define which gate(s) and statistic(s) they would like to obtain data from and how to group the output when extracting data for more than one gate or statistic based on the grouping priority. The grouping priority, defined by the user, enables users to group the output by statistic, gate, marker, quadrant or parameter (depending on the data source, see the 2D Plot Statistic Token Options for more details).
An example output of Token Multiplication Grouping can be seen in the figure below (Figure 12.19). Here, multiple statistics are being extracted from one or more gates (Cells and Gate 1) and placed into a spreadsheet.
In Rows 1 & 2, we can see the simplest example of extracting statistics from a single gate. The output is arranged based on the order the statistics appeared in the Create Statistic window (as indicated previously). In Rows 4 & 5, we have added a second gate to extract statistics from. Here the output is ordered based on the grouping priority (Stats > Gates), which results in each stat being grouped separately and each stat group being ordered by Gate. In Rows 7 - 10 we have expanded the previous example to included data from multiple files. Here each row represents a different file, but the order and statistics are the same.
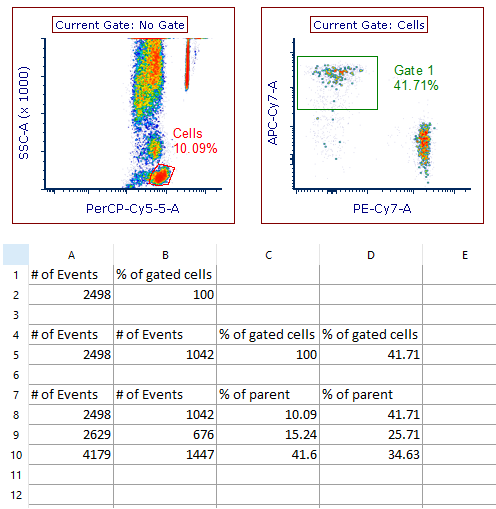
Figure 12.19. Token Multiplication Grouping - Two Gates and Two Stats Example
In Figure 12.20 we can see the Token Multiplication Grouping options selected for the Two Gates and Two Stats example above using a single file. Changing the grouping priority can have a significant effect on the final ordering of the statistics, and will be explained in greater detail in the sections below.

Figure 12.20. Token Multiplication Grouping Options - Two Gates and Two Stats Example
--
Note: the order the gates are displayed in the dialog was changed in version 7.20 onwards. Now, all shown gates (i.e. those whose outline is displayed on the plot of interest) are set to be on top of the list.
--
Grouping Priority - How FCS Express Organizes Token Multiplication Grouping Output
For 1D Plots, the default grouping priority is Stats > Gates > Markers. For 2D Plots the default grouping priority is Stats > Gates > Quadrants. As the grouping priority acts the same for both 1D and 2D plots, we will demonstrate the grouping priority using only 2D Plots below.
With the default grouping priority (Stats > Gates > Quadrants), the primary grouping option is Stats. With this selection FCS Express will output each statistic within its own dedicated block (Figure 12.21). Within each statistic block, the output will be further grouped by gate then by quadrant. With each additional statistic, gate, or quadrant selected the output blocks expand horizontally. In the figure below, we have outlined the default grouping priority using an example with three statistics, multiple gates and a single quadrant. With the primary grouping option set to Stats, the first output block would be Stat1 for each quadrant all gated on Gate1. The next output block would be Stat1 for each quadrant all gated on Gate2, and this would continue for every gate selected. Once the Stat1 output had completed, the process would begin again with Stat2 and finally Stat3. Note that the output would expand horizontally or rightward until all selected statistic, gate and quadrant values had been reported.
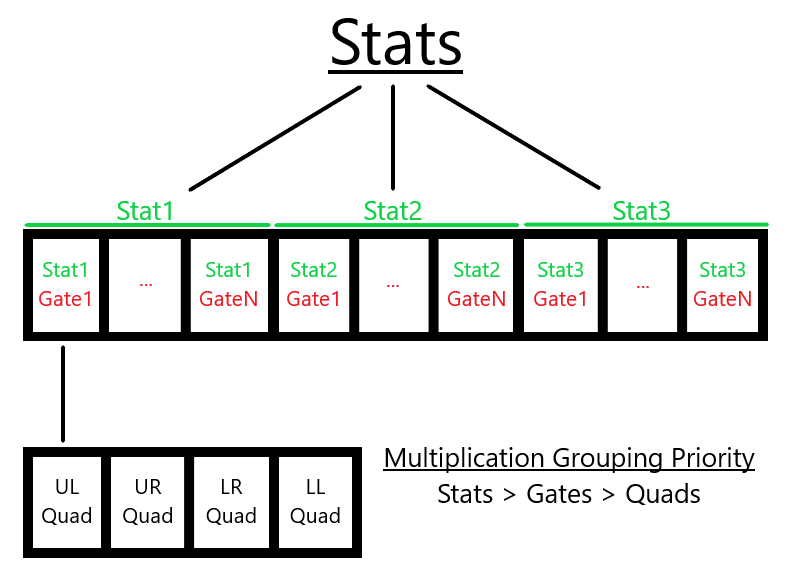
Figure 12.21. Token Multiplication Grouping - Default Priority Grouping for 2D Plots
In the image below (Figure 12.22) we've created a simple gating hierarchy with three plots. We will use the plot displaying four quadrants to extract statistics and demonstrate how the different grouping priority orders influence the resulting output.

Figure 12.22. Token Multiplication Grouping - 2D Plot Example with Simple Gating Hierarchy
For this example, we selected multiple statistics, gates, and quadrants (highlighted in blue, Figure 12.23). In the Create Statistic window, the default grouping priority is set (Stats > Gates > Quads). The grouping priority can be changed by moving a selected grouping option with the Move Up or Move Down buttons, with the highest priority appearing at the top of the Token Multiplication Grouping selection box.

Figure 12.23. Token Multiplication Grouping - Default Options used for 2D Plot Example
--
Note: the order the gates are displayed in the dialog was changed in version 7.20 onwards. Now, all shown gates (i.e. those whose outline is displayed on the plot of interest) are set to be on top of the list.
--
The output can be seen in the figure below, with the default grouping priority set as the first example (Figure 12.24). The first statistic block contains the Gate, which is subdivided by the two selected Gates (Cells then Gate 1), with each Gate's output arranged by Quadrant. The next statistic block contains the # of Events, which is subdivided and arranged first by Gates then by Quadrants. The third block follows the same pattern. In the next example, the grouping priority is set to Stats > Quads > Gates. In this case, the first statistic block is subdivided by Quadrant (LL and LR) with each Quadrant output arranged by Gate (Cells and Gate 1). For each of the examples below, the change to the grouping priority changes the output. In the final example, the grouping priority is Gates > Quads > Stats. Here, the output is first separated by Gate, then subdivided by Quadrant with the output arranged by Statistic. This pattern repeats for the second block. Note that only two blocks were used, as the original selection contained only two Gates (see figure above).
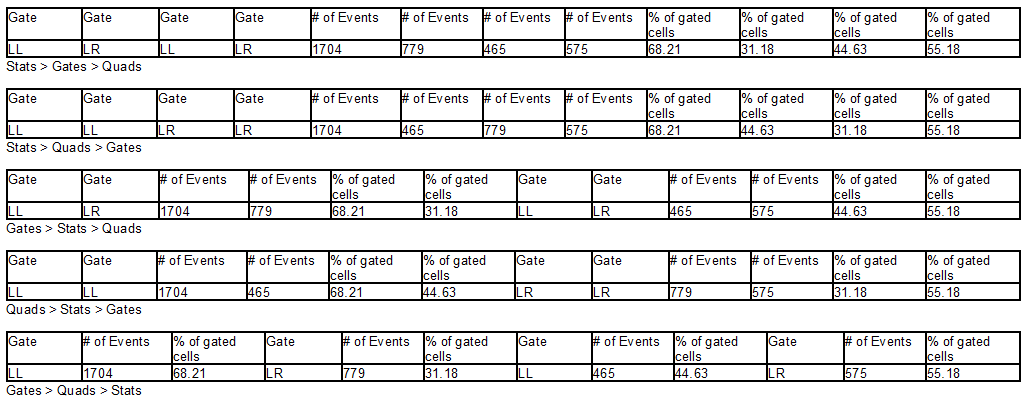
Figure 12.24. Token Multiplication Grouping - Output Examples for 2D Plots with Different Grouping Priorities
We can also output these results into a spreadsheet, which allows for statistics to be extracted simultaneously from multiple data files. The feature is particularly useful when analyzing multiple data files from the data list in spreadsheets. Here we are selecting multiple statistics and gates as above. Note that when dragging and dropping multiple files into a spreadsheet to extract statistics the data files themselves becomes the data source and one or more data parameters must also be selected (see the 2D Plot Statistic Token Options for more details). These data parameters will replace quadrants as the last grouping priority option (Figure 12.25).
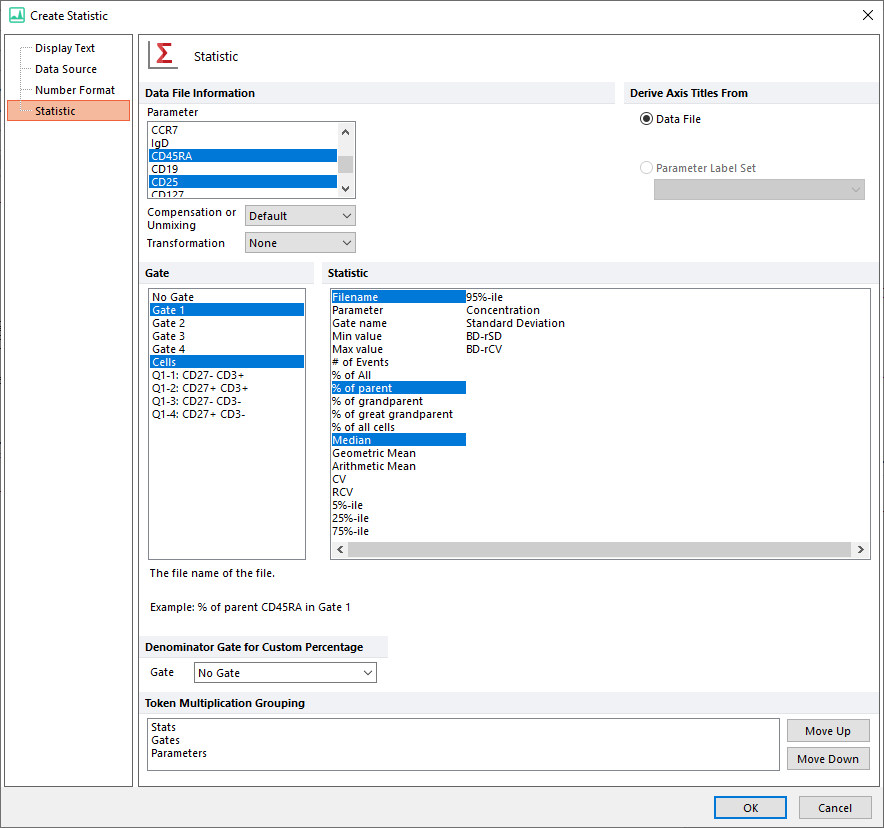
Figure 12.25. Spreadsheet Example - Grouping Options For Multiple Data Files
--
Note: the order the gates are displayed in the dialog was changed in version 7.20 onwards. Now, all shown gates (i.e. those whose outline is displayed on the plot of interest) are set to be on top of the list.
--
The output corresponding to the figure above can be seen in the first five rows of the spreadsheet below (Figure 12.26). In the following rows note the grouping priority has been changed, with the new grouping order indicated in the row immediately beneath the output.
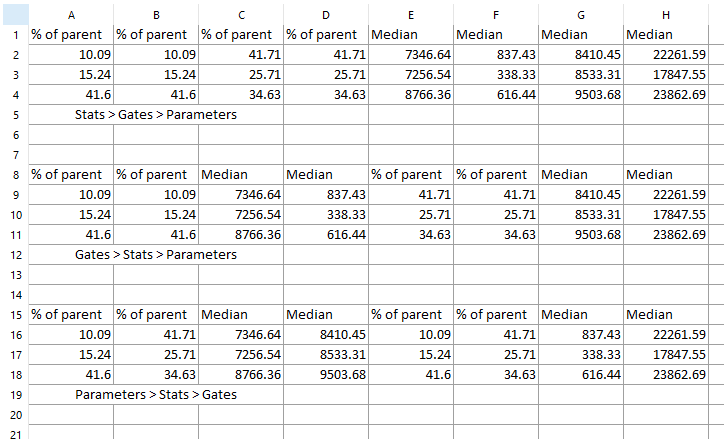
Figure 12.26. Spreadsheet Example - Output Example for Multiple Data Files with Different Grouping Priorities
Note the arrangement of the labels or header row for each statistic can be formatted to appear as a single row or across multiple rows of the spreadsheet (Figure 12.27). See the spreadsheet formatting section for further details.

Figure 12.27. Spreadsheet Example - The Statistic Labels for the Token Multiplication Grouping Output can be arranged as a Single Row (bottom) or Across Multiple Rows (top).
