Gates
Gates are used to define regions of interest on 2D plots. In FCS Express gates can be drawn with different shapes, may be assigned to any position in a gating hierarchy , and an unlimited number of individual gates can be created. Gates can be hidden or shown on plots as desired by using the right-click formatting menu.
Importantly, gates can be used for further downstream analysis as their content can be selectively displayed (applied) on new plots. Gates may also be derived from Markers. In FCS Express 7.20 and later, Quadrants are treated as gates. Gates are manged from a Gate View object or the Gate Navigator.
A special note about quadrants in FCS Express version 7.20 and later:
Quadrants are converted to gates by default. Quadrants no longer have a concept of out of range values. The quadrant borders extend to infinity and the values outside the range are included in quadrants. If out of range events were excluded from quadrants in version, 7.18.0025 and earlier, and the same layout is opened in 7.20 and later, you may notice a change in the reported percentage within quadrants. Consider the example below.
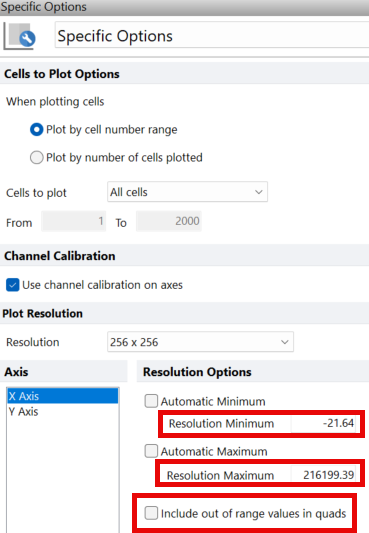
In FCS Express version 7.18.0025, in the Specific Options category of a plot's formatting menu (Figure 7.1), the option Include out of range values in quads was unchecked, and a Resolution Minimum and Resolution Maximum were specified.

Figure 7.1 Specific Options category in FCS Express 7.18.0025
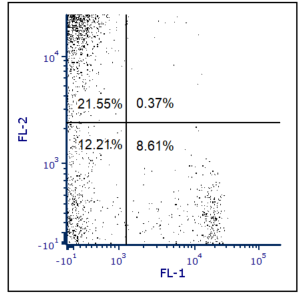
The percentage of events in each quadrant is shown in Figure 7.2.

Figure 7.2 Out of range values are not included in the quadrant percentages.
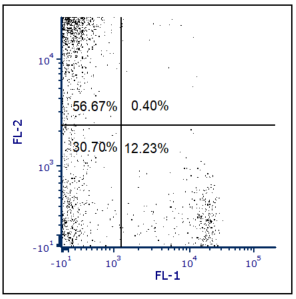
When the layout is saved and opened in version 7.20 or later, the quadrants automatically include out of range values. For this reason, the reported percentage of events in each quadrant is different than in the image above. Notice in Figure 7.3 that sum of the values is 100%.

Figure 7.3 Out of range values are automatically included in quadrants in FCS Express 7.20 and later
