
对图像绘图进行门操作 |

|

|

|
|
|
对图像绘图进行门操作 |
|
|

|
对图像绘图进行门操作
|
对图像绘图进行门操作 |
|
|
|
|
|
对图像绘图进行门操作 |
|
|
|
|
|
||
在这一节中,我们将学习如何:
| • | 在图像绘图上添加门 |
| • | 调整图像绘图选项以便查看门 |
| • | 从图像绘图向散点图添加后置门或者从散点图向图像绘图添加后置门 |
| • | 查看图像绘图门对应的统计数据 |
在一个图像绘图上应用门和在任何FCS Express中的其它绘图上应用门非常类似。想要对门操作有一个初步了解,请查看门操作教程。
| 1. | 请打开一个新版面。 |
| 2. | 请选择Data(数据)→Organize Data Sets(组织数据集)→Data List(数据列表)命令。 |
| 3. | 请从Tutorial Sample Data archive(教程样本数据库)中把pictureplotsample1.dns导入Data List(数据列表)中。 |
| 4. | 请把pictureplotsample1.dns文件从Data List(数据列表)中拖放到版面上。 |
| 5. | 请点击Picture Plot(图像绘图)以及Color Dot(彩色点状图),然后保证其它复选框没有被选中(图T26.8)。 |
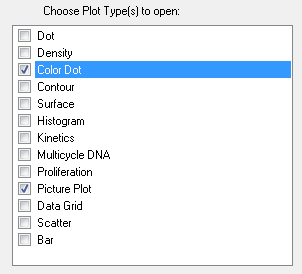
图T26.8 Choosing to Insert a Picture Plot and Color Dot Plot(选择插入图像绘图以及彩色点状图)
| 6. | 请点击OK。 |
这时该文件对应的彩色点状图以及图像绘图会出现在版面中。请把这两个图并排排列,如图T26.9所示。
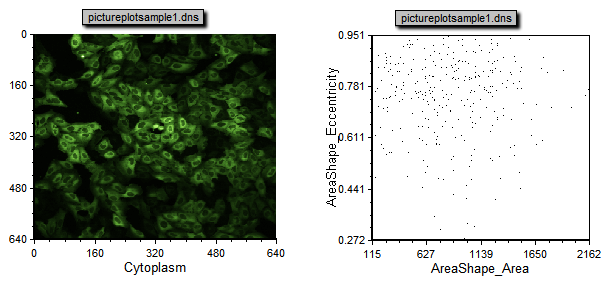
图T26.9 Arrangement of the Picture Plot and Color Dot Plot on the Layout (在版面上排列图像绘图以及彩色点状图)
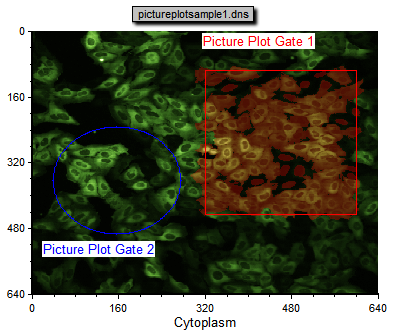
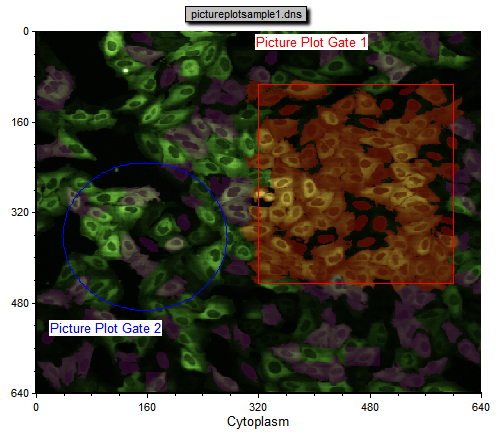
| 7. | 请在图像绘图上创建一个如图T26.10中所示的矩形门,然后将其命名为Picture Plot Gate 1(图像绘图门1)。 |
| 8. | 请在图像绘图上再创建一个如图T26.10中所示的门(椭圆形门)并将其命名为Picture Plot Gate 2(图像绘图门2)。 |
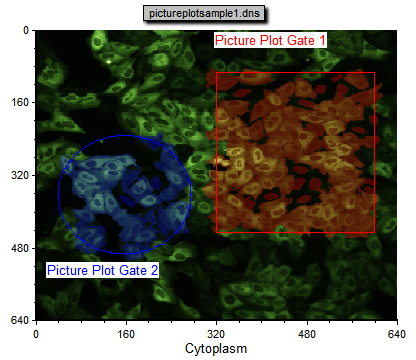
图T26.10 Creating Gates on the Picture Plot (在图片绘图上创建门)
注意到图像绘图中,在门中的细胞也被高亮为和门相同的颜色(图T26.10)。同时也注意到彩色点状图中不同颜色门中的细胞有着不同的颜色。有时,在点状图上区分不同颜色或者不同事件可能会有些困难,因为一个图片只有有限的事件数。让我们现在来对点状图进行格式化,以便更加容易地对其进行查看和分析。
| 9. | 请右键点击彩色点状图。 |
| 10. | 请从弹出菜单上选择Format(格式)。 |
| 11. | 请选择Overlays(叠加图层)类别选项。 |
| 12. | 请把Dot size(数据点大小)改为10。 |
| 13. | 请点击OK。 |
数据点图现在看起来应该如图T26.11所示,在不同图像绘图门中的事件也更容易区分。
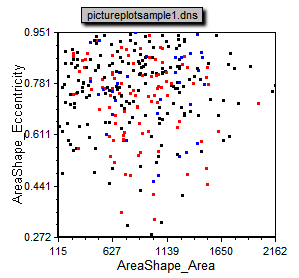
图T26.11 Color Dot Plot with Dots Enlarged (数据点被放大的彩色点状图)
我们现在要对图像绘图进行格式化以便仅仅显示一个图像绘图门中的细胞。
| 14. | 请右键点击图像绘图。 |
| 15. | 请从弹出菜单上选择Format(格式)。 |
| 16. | 请选择Picture Plot Options(图像绘图选项)→Display Gates Options(显示门选项)类别选项。 |
| 17. | 请选择All gates except those checked below(除了下面中的门之外所的门)单选按钮(图T26.12)。 |
| 18. | 请点选复选框Picture Plot Gate 2(图像绘图门2)(图T26.12)。 |
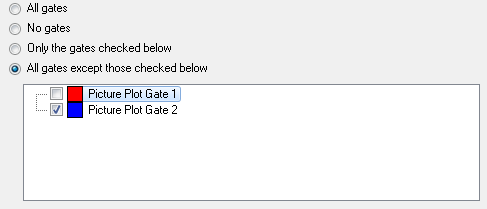
图T26.12 Choosing to Display All Gates Except Picture Plot Gate 2 (选择显示除了图像绘图门2以外的其它门)
| 19. | 请点击OK。 |
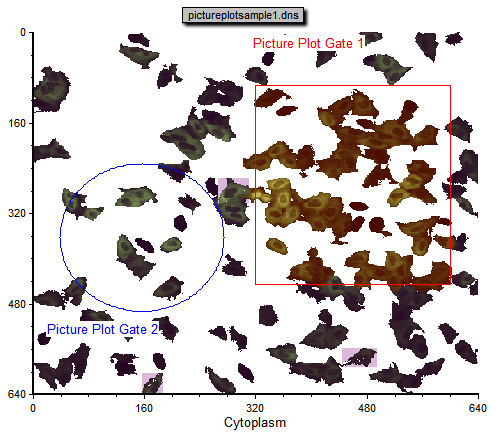
这时的图像绘图看起来应该如图T26.13所示,图中仅仅特别显示了图像绘图门1中的细胞。
图T26.13 Picture Plot Highlighting Only Cells Found Within Picture Plot Gate 1 (图像绘图仅仅高亮显示在图像绘图门1中的细胞)
我们现在将根据图像绘图门来对彩色点状图进行门操作。
| 20. | 请点击彩色点状图,将其选中。 |
| 21. | 请来到Gating(门操作)→Create Gates(创建门)→Current Gate(当前门),然后从Current Gate(当前门)下拉列表中选择Picture Plot Gate 1(图像绘图门1)。 |
注意到彩色点状图现在仅仅显示图像绘图门1中定义的事件(图T26.14)。
图26.14 Color Dot Plot Displaying Cells from Picture Plot Gate 1 (显示图像绘图门1中的细胞的彩色点状图)
我们现在来在彩色点状图上设置一个门并将其应用到图像绘图上。
| 22. | 请按下Ctrl+Z,取消门操作。 |
| 23. | 请在彩色点状图上创建一个如图T26.15中所示的矩形门并将其命名为Dot Plot Gate(点状图门)。 |
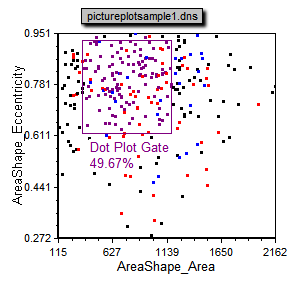
图T26.15 Applying a Gate to the Dot Plot (把一个门应用于点状图)
注意到图像绘图现在用紫色来显示那些刚刚在点状图上创建的门中的细胞(图T26.16)。请移动一下点状图门并观察图像绘图中紫色的细胞随点状图门移动而变化的情况。当根据数值结果来选定某一细胞群时,这种门操作的方法可能会比较有用。
图T26.16 Picture Plot Displaying the Dot Plot Gated Cells in Purple (把点状图门中的细胞显示为紫色的图像绘图)
在点状图门中的细胞也可以显示在没有背景的图像中。
| 24. | 请右键点击图像绘图。 |
| 25. | 请从弹出菜单上选择Format(格式)。 |
| 26. | 请选择Overlays(叠加图层)类别选项。 |
| 27. | 请取消对Show Background Image(显示背景图像)的点选。 |
| 28. | 请点击OK。 |
| 29. | 请来到Gating(门操作)→Create Gates(创建门)→Current Gate(当前门),然后从Current Gate(当前门)下拉列表中选择Dot Plot Gate(点状图门)。 |
图像绘图现在看起来应该如图T26.17所示,显示仅仅在点状图门中的细胞。请移动一下点状图门并实时地观察图像绘图中细胞的变化。
图T26.17 Picture Plot with Dot Plot Gate Applied (应用了点状图门的图像绘图)
接下来,我们将为图像分析使用数据网格。