
导入单个图片数据 |

|

|

|
|
|
导入单个图片数据 |
|
|

|
导入单个图片数据
|
导入单个图片数据 |
|
|
|
|
|
导入单个图片数据 |
|
|
|
|
|
||
这一部分涉及一组不是从96孔板中、而是从比如玻片上获取的单个图片。
在CellProfiler中调整导出设置并运行了管道后,用户便可以来分析图片并把数据导入到FCS Express第4版中。
| 1. | 请在CellProfiler中导入Section2pipelineCOMPLETED.cp管道文件。 |
| 2. | 请在CellProfiler中选择默认的输入以及输出文件夹来导入和保存数据,如图T24.13所示。 |
| 3. | 在CellProfiler中分析图片。 |
把单个图片实验导入到FCS Express中
在进行下列步骤之前,我们需要对FCS Express Preferences(FCS Express选项)进行一些说明:
用户需要激活File selection(文件选择)对话框:
| A. | 请来到 Application Button(应用程序按钮)→Edit Preferences(编辑选项)→General(常规)。 |
| B. | 请点选Always show a file selection dialog when opening new plots or showing a window that uses a data file(打开新绘图或显示使用数据文件的窗口时总是显示文件选择窗口)复选框。 |
(该选项不是使用FCS Express时的必须选项, 我们在此将其打开仅仅是为了方便起见。)
| 4. | 请打开FCS Express第4版。 |
| 5. | 请打开Edit Preferences(编辑选项)对话框,然后从Data Loading(数据导入)类别选项中选择Cell Profiler Options(CellProfiler选项)(图T24.19)。 |
| 6. | 请从delimiter(分隔符)下拉列表中选择csv(逗号分隔值)。 |
| 7. | 请选中Load Images(导入图片)复选框。 |
| 8. | 请取消对Load path names from Cell Profiler table of contents file(从CellProfiler内容表格文件中导入路径名)复选框的勾选。 |
| 9. | 请点击OK,关闭Edit Preferences(编辑选项)对话框。 |
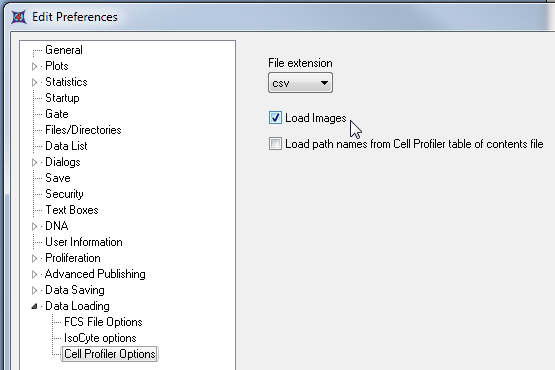
图T24.19 CellProfiler Data Loading Options(CellProfiler数据导入选项)
| 10. | 请选择Insert(插入)→2D Plots(二维绘图)→Picture Plots(图像绘图) 命令 (图T24.20)。 |
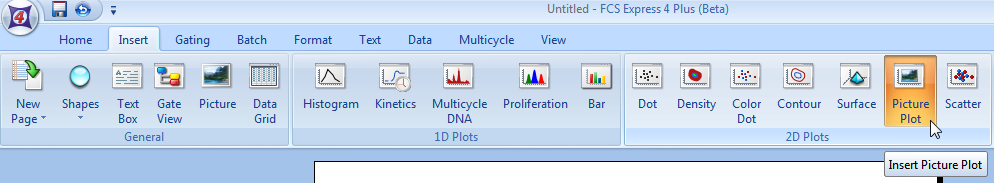
图T24.20 Choosing a Picture Plot to Insert (选择要插入的图片绘图)
| 11. | 请在版面中点击,这时会出现Select a Data File(选择数据文件)对话框。 |
| 12. | 请来到你存储从CellProfiler中导出的数据所在的Default Output Folder(默认输出文件夹)中。 |
| 13. | 请从Files of type:(文件类型:)下拉列表中选择CellProfiler (*.cpout)(图T24.21)。 这时会出现从CellProfiler中导出的文件的图标。 在本例中,它们是cells_05.cpout以及nuclei_05.cpout文件。 |
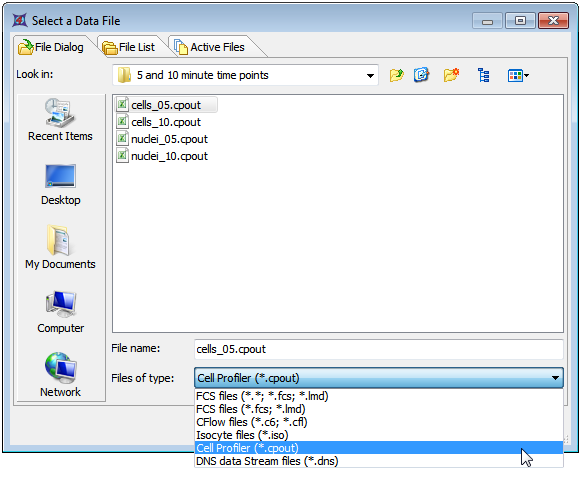
图T24.21 Select a Data File Dialog (选中数据文件对话框)
| 14. | 请点选cells_05.cpout,然后点击Open(打开)。 |
注: 在本例中,我们将使用cells_05.cpout文件,本文件将显示CellProfiler中被IdentifySecondaryObjects(确定次要对象)模块确定为5分钟时间点的那些对象,它们对应于整个细胞的面积。 Nuclei_05.cpout将显示被CellProfiler中IdentifyPrimaryObjects(确定主要对象)模块确定为5分钟时间点的那些对象,它们对应于细胞核的面积。
| 15. | 请在Open 2D Plots(打开二维绘图)对话框中的Image Parameter(图片参数)列表框中选择Cytoplasm(细胞质)(图T24.22) ,以便查看细胞质图像。 |
| 16. | 请点击OK。 |
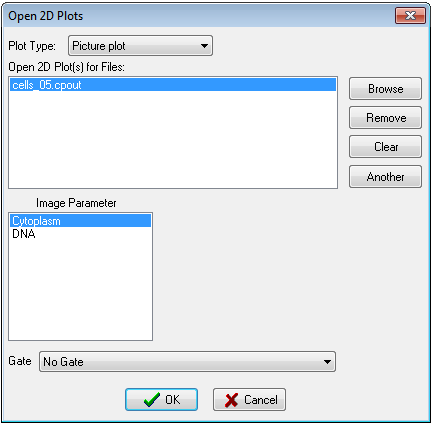
图T24.22 Choosing Image Parameters from the Open 2D Plots Dialog (从打开的二维绘图对话框中选择图片参数)
这时在版面上会出现一个Picture Plot(图像绘图),表明数据已被成功导入(图T24.23)。
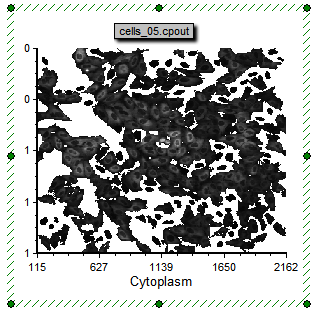
图T24.23 Example of the Cells (5 Minute Time Point) Picture Plot (细胞(5分钟时间点)图片绘图实例)
在该Picture Plots(图像绘图)上可创建任何二维绘图。 根据图像绘图上的门所创建的二维绘图,可以让用户使用熟悉的点状图来查看数据,也可以让用户只查看图像绘图中的几部分(图T24.24)。
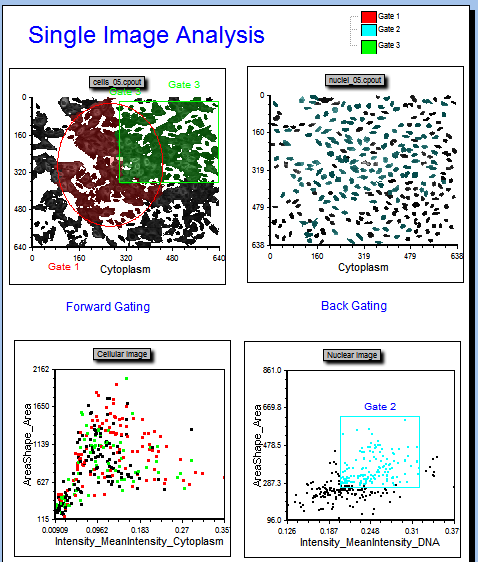
图T24.24 Example of Gating on a Picture Plot and Backgating from a Dot Plot to a Picture Plot (在图片绘图上进行门操作以及从点状图到图片绘图的后置门操作)
在下一个练习中,我们将仅从一个96孔板中导出数值数据。