
在统计窗口中显示浓度 |

|

|

|
|
|
在统计窗口中显示浓度 |
|
|

|
在统计窗口中显示浓度
|
在统计窗口中显示浓度 |
|
|
|
|
|
在统计窗口中显示浓度 |
|
|
|
|
|
||
在本例中,我们会:
| • | 使用微珠(或时间)以及流速来设置浓度计算器,以在版面中显示结果。 |
| • | 把计算好的浓度作为统计数据显示在统计窗口中。 |
我们已经学会了怎样对一个样本中的细胞浓度进行一次性地计算。我们现在要学习如何使用statistics window(统计窗口)把这些数据显示在版面中。
| 1. | 请右键点击包括Beads1(微珠)以及Monocytes(单核细胞)门的、带有前向以及侧向散点的绘图,调出弹出菜单。 |
| 2. | 请从弹出菜单上选中Gate Statistics(门统计)。 |
这时会出现statistics window(统计窗口)(图T22.8)。请把统计窗口移到版面上一个方便操作的位置上。
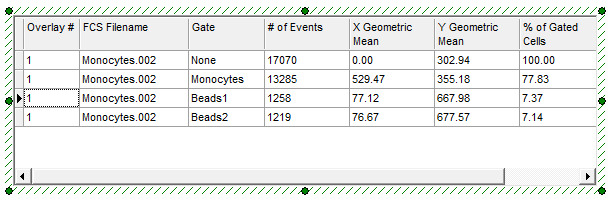
图T22.8 Statistics Window (统计窗口)
| 3. | 请在statistics window(统计窗口)上左键点击,将其选中;窗口应该有一个绿色的边框(图T22.8)。 |
| 4. | 请选中Format(格式)→Statistics Options(统计选项)→Statistics(统计)命令(图T22.9)。 |
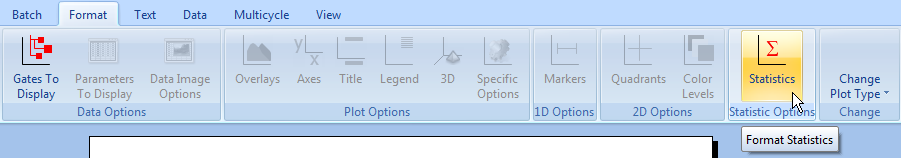
图T22.9 Selecting Format Statistics Command (选中格式化统计命令)
这时会出现Formatting Statistics(格式化统计)对话框(图T22.10)。我们现在要来选择在版面中的statistics window(统计窗口)中显示哪些统计数据。
| 5. | 请在Formatting Statistics(格式化统计)对话框中仅仅选择以下选项(图T22.10): |
| • | Gate(门) |
| • | Number of Events(事件数) |
| • | % of Gated Cells(门中细胞百分比) |
| • | % of All Cells(占总细胞百分比) |
| • | Concentration(浓度) |
| 6. | 请点击OK,关闭Formatting Statistics(格式化统计)对话框。 |
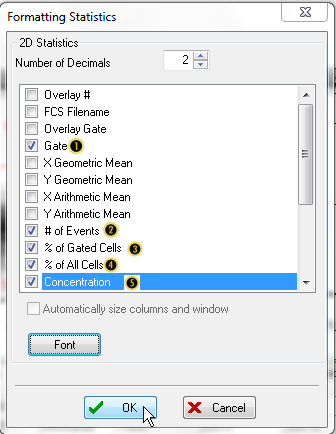
图T22.10 Formatting Statistics Dialog (格式化统计对话框)
这时会出现statistics window(统计窗口),如图T22.11所示,显示仅仅在Formatting Statistics(格式化统计)对话框中选中的项目。
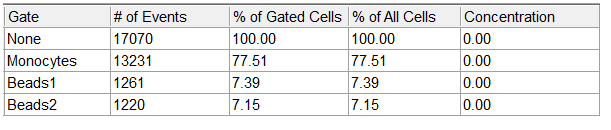
图T22.11 Statistics Window after Formatting (格式化后的统计窗口)
我们有两种其它的方法来对statistics window(统计窗口)进行格式化,以便仅仅显示我们想要的统计:
| • | 使用statistics window(统计窗口)弹出菜单来选中要显示的统计: |
| A. | 请右键点击statistics window(统计窗口),调出相关的弹出菜单(图T22.12)。 |
| B. | 请左键点击想要显示的统计选项。 |
| C. | 请左键点击那些你不想要的选项(图T22.12)。 |
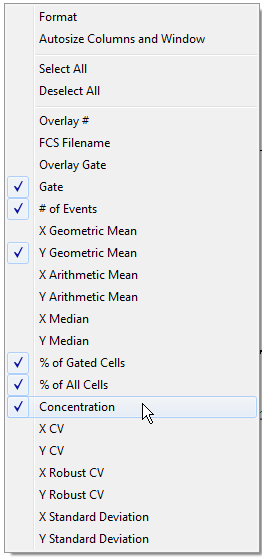
图T22.12 Statistics Window Pop-up Menu (统计窗口弹出菜单)
| • | 使用statistics window Format(统计窗口格式)对话框来选中要显示的统计: |
| A. | 请右键点击statistics window(统计窗口),调出相关菜单(图T22.12)。 |
| B. | 请从弹出菜单上选中Format(格式)。 |
| C. | 请从Format(格式)对话框左侧区域中选中Stats(统计)类别选项(图T22.13)。 |
| D. | 请设置你想要显示的统计,然后点击OK(图T22.13)。 |
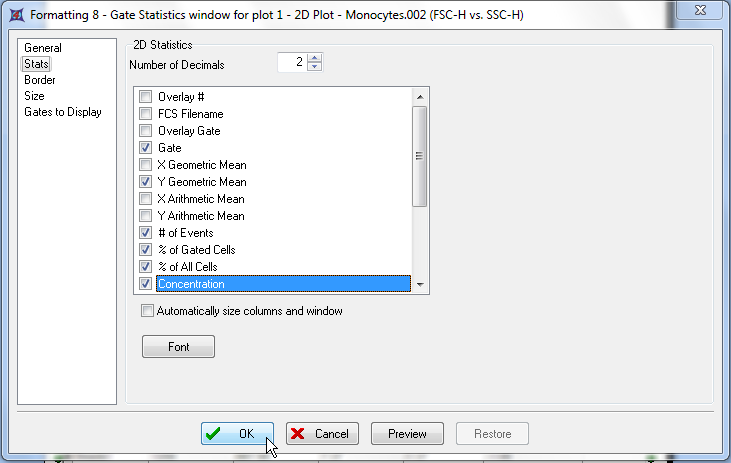
图T22.13 Stats Category of the Statistics Window Format Dialog (统计窗口格式对话框中的统计类别选项)
正如图T22.11中所示,statistics window(统计窗口)中有一列为Concentration(浓度),但它还未进行定义,所以只显示零。我们现在就来对FCS Express进行设置,来计算这些浓度。
| 7. | 请选中View(视图)→Tools(工具)→Concentration Calculator(浓度计算器)命令(图T22.5)。 |
这时会出现Concentration Calculator(浓度计算器)对话框,如前图T22.7所示。
| 8. | 请点击名为Stats Window Setup(统计窗口设置)的第二个标签卡(图T22.14)。 |
和前面一样,有两种计算浓度的方法: a) 指明一个(bead gate)微珠门并给出样本中微珠的浓度,或者b) 使用数据采集中获得的time(时间)和样本flow rate(流速)。我们将在这里设置参考微珠,如图T22.14所示。
| 9. | 请选中Reference Beads(参考微珠)单选按钮。 |
| 10. | 请从微珠门下拉列表中选中Beads2(微珠2)。 |
| 11. | 请在Bead Concentration(微珠浓度)字段输入100000。 |
| 12. | 请点击OK (图T22.14)。 |
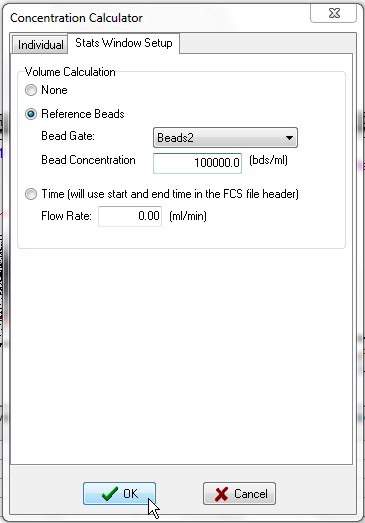
图T22.14 Concentration Calculator Dialog -- Stats Window Setup (浓度计算器对话框 -- 设置统计窗口)
现在,statistics window(统计窗口)中的Concentration(浓度)列会显示根据我们前面定义的参数计算出的绘图中的所有门的浓度(图T22.15)。这个设置会应用于整个版面,并被用来计算版面中所有绘图的浓度统计。
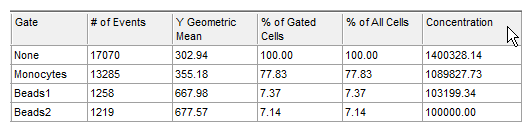
图T22.15 Statistics Window with Concentration Results by Gate (统计窗口以及根据门计算出的浓度结果)
接下来,我们将把浓度作为一个标记来进行显示。