Adding Error Bars(添加误差线)
可以在Bar Plots(条形图)和Scatter Plots(散布图)中添加误差线和高亮显示。本例中,显示了如何在条形图中添加特性。
| 1. | 选择File(文件)标签→Open(打开)。 |
| 2. | 在Tutorial Sample Data archive(教程样本数据库)中打开“Error Bars.fey”。 |
在布局中已经存在一个Custom Data Grid(自定义数据网格)及与其相关的不带误差线或高亮显示的条形图。此条形图以“apo”的方式和“necro”%-门数据统计形式对三种Color Dot Plots(彩色点图)进行绘制。通过使用array formulae(数组公式)在Custom Data Grid(自定义数据网格)中完成,当点击“dataset 1”列中的任何一个都可以显示出来(图. 30,红色表示)。
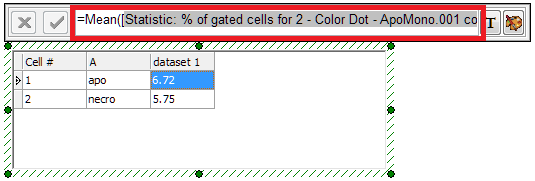
Figure 30. Array formula (partially visible here) for calculating the mean of three tokens in a Custom Data Grid
用户还可使用array formulae(数组公式)来计算误差线;但是,误差线可能来源于默认的统计标识或者自由文本。
| 3. | 点击“dataset 1”列中任何细胞将其选中。 |
| 4. | 右击Custom Data Grid(自定义数据网格)的“dataset 1”列。 |
| 5. | 选择Insert(插入)→Column to the Right(把列插入到右侧)从弹出菜单中(图. 31 |
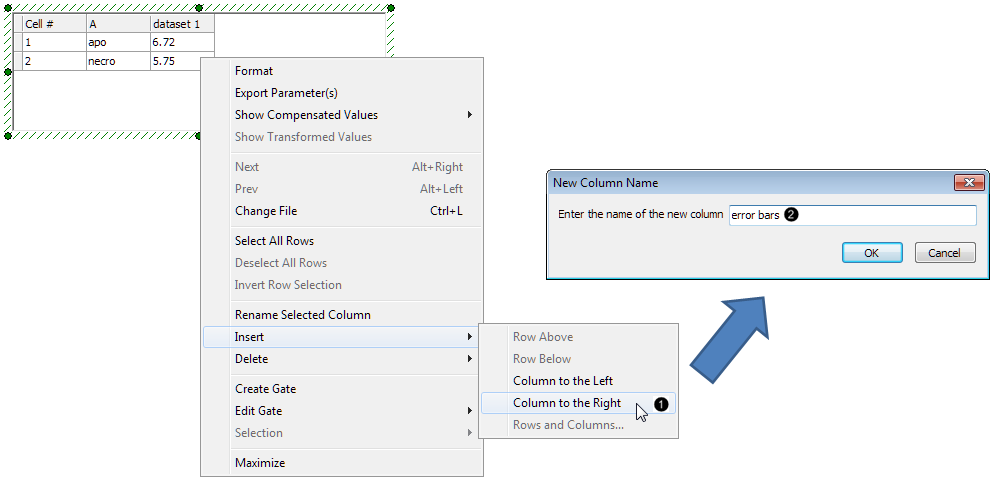
Figure 31. Inserting a Column in a Custom Data Grid
| 6. | 在New Column Name(新列名)对话框中点击“error bars(误差线)”(图. 31 |
| 7. | 点击OK。 |
| 8. | 请点击自定义数据网格中第1列的误差线(图. 32 |
| 9. | 请在自定义数据网格公式编辑器中输入"="(图. 32 |
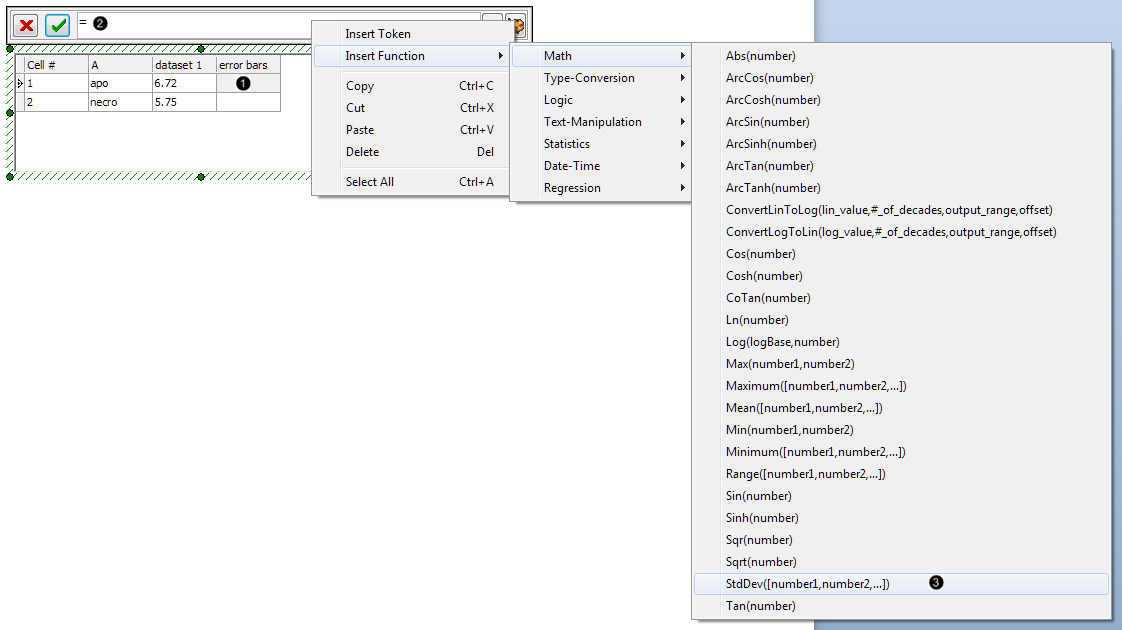
Figure 32. Inserting a function into the Custom Data Grid cell
| 10. | 然后右击自定义数据网格公式编辑器。 |
| 11. | 从弹出菜单中选择Insert Function(插入功能)→Math(公式)→StdDev([number1,number2,...])(图. 32 |
然后再布局绘图中输入Statistic Tokens(统计标识)作为StdDev(标准偏差)array formulae(数组公式)的元件。
| 12. | 双击自定义数据网格公式编辑器中StdDev(标准偏差)公式中的“number1”元件,其将被用蓝色高亮显示(图. 33 |
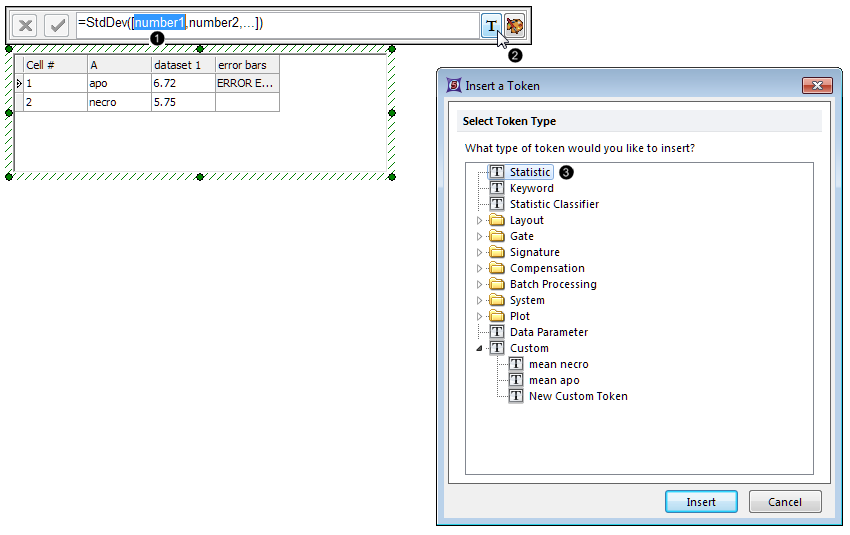
Figure 33. Entering a token as a component of the Standard Deviation formula
| 13. | 点击 |
| 14. | 双击Statistic(统计)在插入的标识对话框中(图. 33 |
| 15. | 点击2-Color Dot-Apomono.001... (2色点图)从Data Source(数据源)类中→选择一个绘图(图. 34,鼠标箭头处)。 |
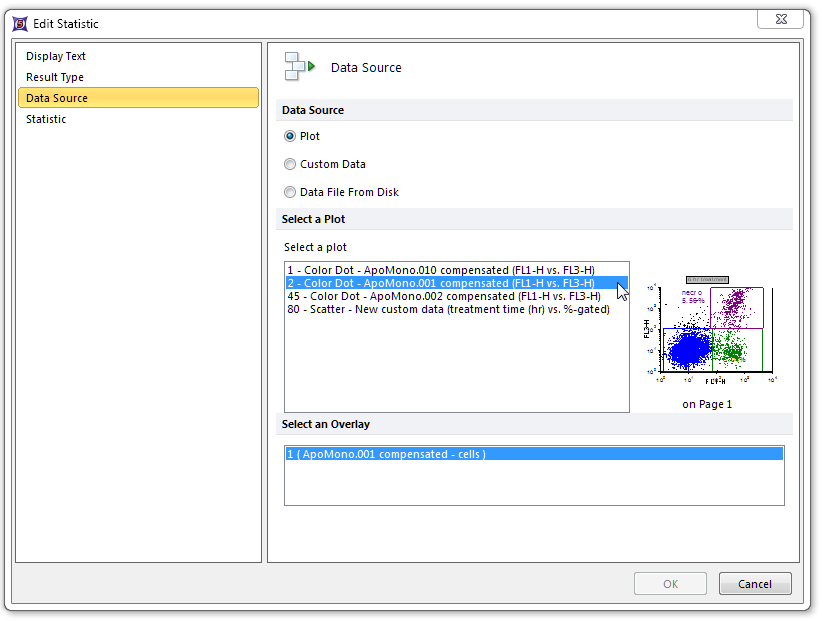
Figure 34. Choosing the Data Source of a token for insertion in the Custom Data Grid
| 16. | 点击Statistic(统计)项(图. 35 |
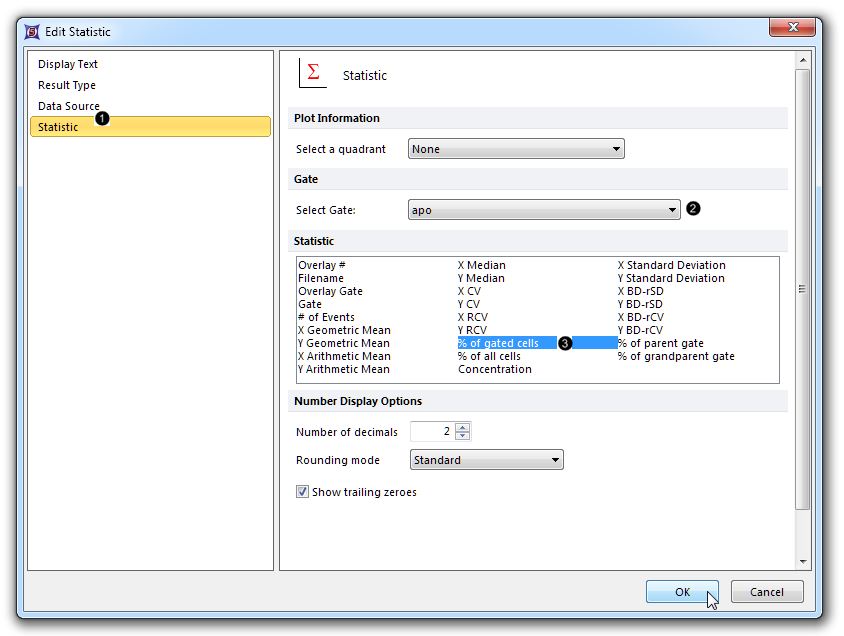
Figure 35. Choosing the gate and statistic for the token being inserted in the Custom Data Grid
| 17. | 从Select Gate(选择门)下拉列表中选择“apo”(图. 35 |
| 18. | 选择% of Gated Cells(门中细胞百分比)从Statistic(统计)列表框中(图. 35 |
| 19. | 点击OK。 |
| 20. | 双击自定义数据网格公式编辑器中StdDev(标准偏差)公式中的“number2”元件,其将被用蓝色高亮显示(图.36)。 |
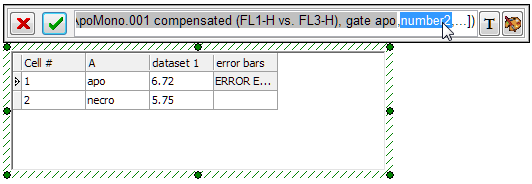
Figure 36. Double-clicking on a component of an array formula to replace it with a token
| 21. | 重复13-19步骤,用以下所示修改方法: |
| • | 第15步:点击3-Color Dot-Apomono.002...从Data Source(数据源)类中→选择一个绘图。 |
| • | 第17步:从Select Gate(选择门)下拉列表中选择“apo 2”, |
| 22. | 突出显示自定义数据网格公式编辑器中StdDev(标准偏差)公式中的省略号("...")元件(图. 37)。 |
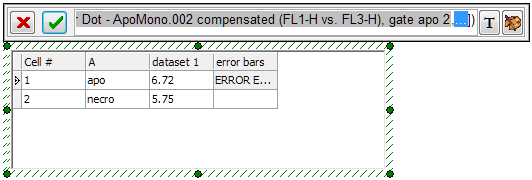
Figure 37. Double-clicking on the ellipsis component of an array formula to replace it with a token
| 23. | 重复13-19步骤,用以下所示修改方法: |
| • | 第15步:点击4-Color Dot-Apomono.003...从Data Source(数据源)类中→选择一个绘图。 |
| • | 第17步:从Select Gate(选择门)下拉列表中选择“apo 3”。 |
针对误差线,自定义数据网格"apo" 行就包含一个完整的StdDev(标准偏差)数组公式,且该误差线已用网格中右上角细胞结果进行评估(图. 38)。
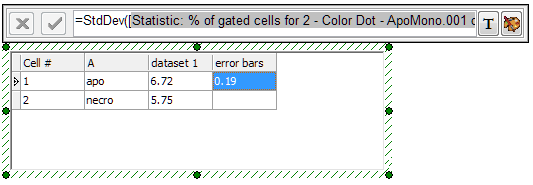
Figure 38. Completed array formula within the Custom Data Grid and its result displayed in the selected Cell
通过复制和粘贴Statistic Tokens(统计标识)元件中完整的、用户刚创建和改变的门StdDev(标准偏差)公式,来出入自定义数据网格中针对"necro"行的相应的误差线。
| 24. | 点击在第9-23步中创建的带有完整StdDev(标准偏差)的自定义数据网格中第一行的"error bars(误差线)"列(图. 39 |
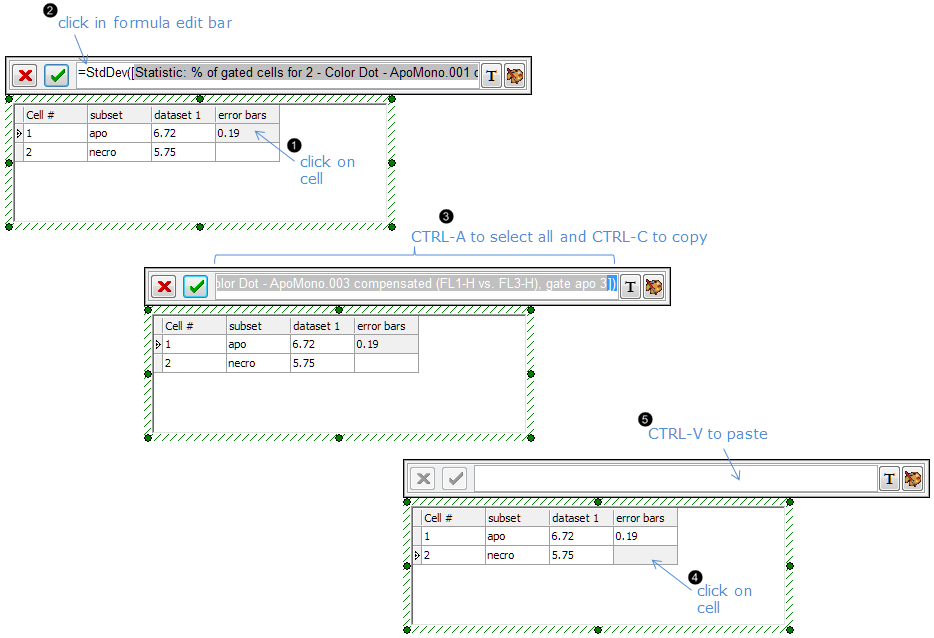
Figure 39. Copying and pasting an array formula from one cell to another in the Custom Data Grid
| 25. | 点击自定义数据网格公式编辑器(图. 39 |
| 26. | 按下键盘上的CTRL+A按钮,全部选中。 |
| 27. | 按下键盘上的CTRL+C按钮进行复制(图. 39 |
| 28. | 请点击自定义数据网格中第2行的"error bars(误差线)"列(图. 39 |
| 29. | 点击进入自定义数据网格公式编辑器。 |
| 30. | 按下键盘上的CTRL+V按钮 ,粘贴公式(图. 39 |
| 31. | 双击自定义数据网格公式编辑器中StdDev(标准偏差)公式中的第一个标识元件(statistic:% of gated cells for 2 - Color Dot - ApoMono.001 compensated....(统计:2色散点图中门中细胞百分比-ApoMono.001 补偿))。 |
| 32. | 点击Statistic(统计)项(图. 40 |
| 33. | 从Select Gate(选择门)下拉列表中选择“necro”(图. 40 |
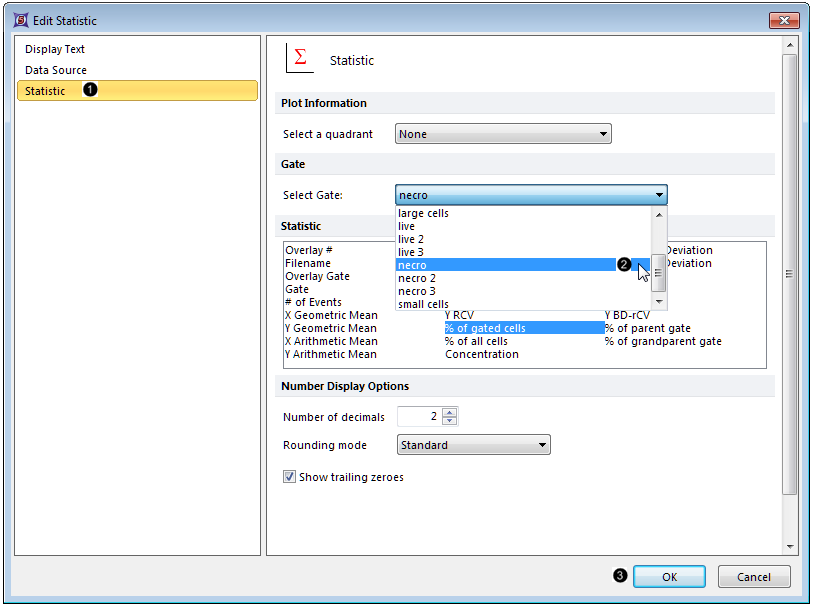
Figure 40. Editing a token
| 34. | 点击OK(图. 40 |
| 35. | 在第2行的"error bars"列StdDev(标准偏差)公式中第二和第三标识处重复第31-34步骤,分别选择"necro 2" 和 "necro 3"门。 |
| 36. | 双击条形图,打开Formatting (格式化)对话框。 |
| 37. | 点击Overlays(数据层)项(图. 41 |

Figure 41. Adding error bars to a Bar Plot in the Formatting dialog
| 38. | 从2D Bar Overlay Options(二维条形图数据层选项)→Error Bar Param(误差线参数)下拉列表中选择“error bars(误差线)”(图. 41 |
| 39. | 从Color(颜色)选项中选择red(红色),在Error Bar Properties(误差线属性)弹出菜单的部分(图. 41 |
| 40. | 点击OK(图. 41 |
此时,条形图就将出现如右图. 41所示
| 41. | 可选项目: |
| • | 点击Data(数据)标签→Change Data on All(修改所有数据)→ Next/Previous(下一项/前一项)通过设置Data List(数据列表)中的文件及观看新数据的更新如条形图和散步图来向前发展。 |
| • | 实时调整绘图上的门及观看条形图和散步图的更新。 |
在下一章节,我们将增加针对条形图、散步图和饼状图的高亮和爆炸参数的功能介绍。
