<< Click here to display Table of Contents >>
在此教程的最后部分,我们将强大的ΦΧΣ Εξπρεσσ批处理功能创建PowerPointä和Excelä报表。
版面已被保存为相连接的 .fcs格式文件,位于同一文件夹下,此版面类似于完成previous section of the tutorial(先前教程章节)后用户自己的版面。用户可在这一版面或者用户自己版面中进行第3步操作。
| 3. | 选择Batch(批处理)标签→Batch Processing(批处理)→Batch Actions(批操作)(图T29.37)。 |

Figure T29.37 Opening the Batch Actions window
| 4. | 移动batch actions(批操作)窗口到页面的一边,这时绘图就可看见。 |
| 5. | 点击位于Batch Actions(批操作)窗口下,Add Action(添加操作)项目类别中 的Save to Powerpoint(保存至Powerpoint)(图T29.38 )。 )。 |
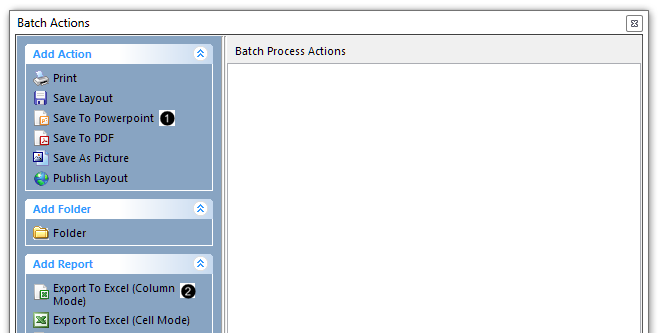
Figure T29.38 Batch actions window
| 6. | 点击自动打开的Create Export to Powerpoint Action(创建导出到Powerpoint操作)对话框中的Open presentation after saving(保存后打开演示文稿)(图T29.39,左边  )。 )。 |
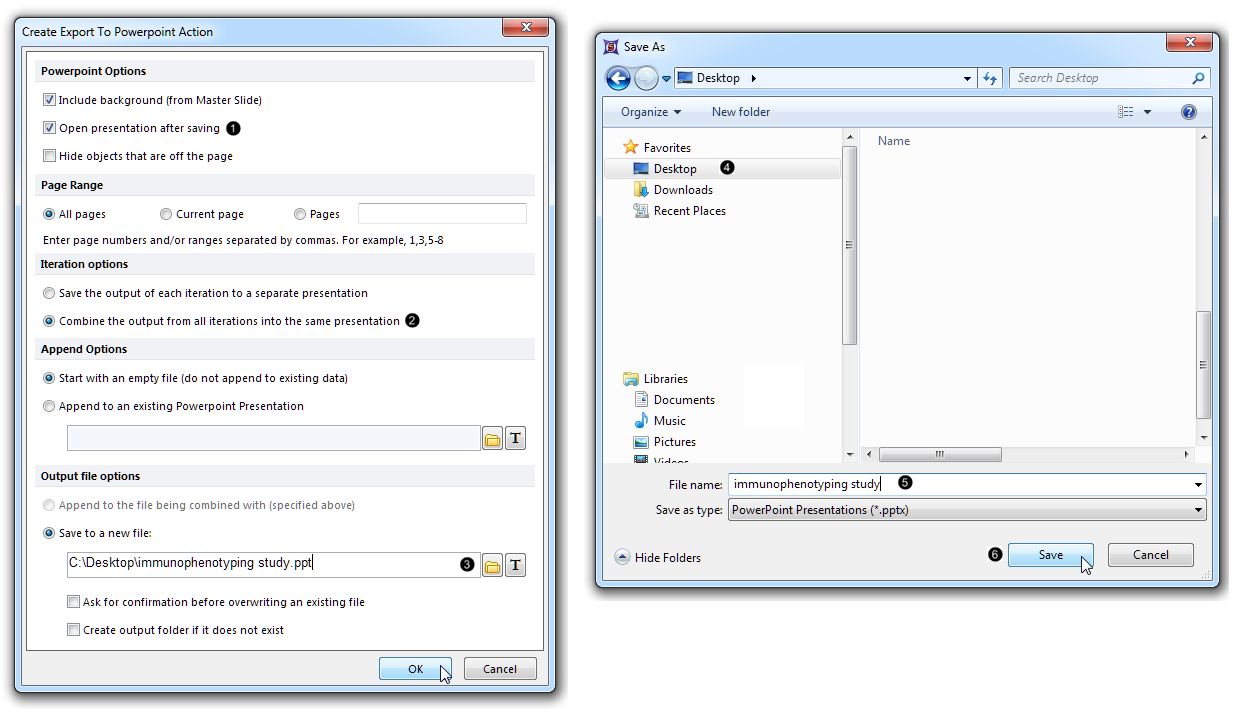
Figure T29.39 Adding a PowerPoint action to Batch Process Actions
| 7. | 请点击位于Iteration options(循环选项)部分的 Combine the output from all iterations into the same presentation(把所有循环输出的结果合并到一个演示文稿中)单选按钮(图T29.39,左边, )。注意:第一个单选按钮,如果被选选中,将让每个样本保存到其单独的PPT文件中。 )。注意:第一个单选按钮,如果被选选中,将让每个样本保存到其单独的PPT文件中。 |
| 8. | 点击位于Output file options(输出文件选择)部分中,Save to a new file (保存到一个新的文件)下的文件夹图标(图T29.39,左边  )。 )。 |
| 9. | 导航到导出文件保存位置的目录文件夹(例如,桌面),在Save As(保存为)对话框窗口(图T29.39,右边  )。 )。 |
| 10. | 在File name(文件名)处输入"immunophenotyping study"(图T29.39,右边  )。 )。 |
| 11. | 点击Save(保存)(图T29.39,右边  )。 )。 |
| 12. | 请在Create Export to Powerpoint Action(创建导出到Powerpoint操作)对话框中点击OK(图T29.39,左边, 鼠标指针)。 |
| 13. | 在Batch actions(批操作)窗口中,Add Report(添加报表)项目类别中点击 Export to Excel (Column Mode) (导出到Excel(列模式))(图T29.38 )。 )。 |
| 14. | 点击位于Excel (Column Mode) Options(Excel(列模式)选项)对话框中,Output file options(输出文件选项)中,位于Save to a new file(保存到一个新的文件)下方的文件夹图标 (图T29.40 )。 )。 |
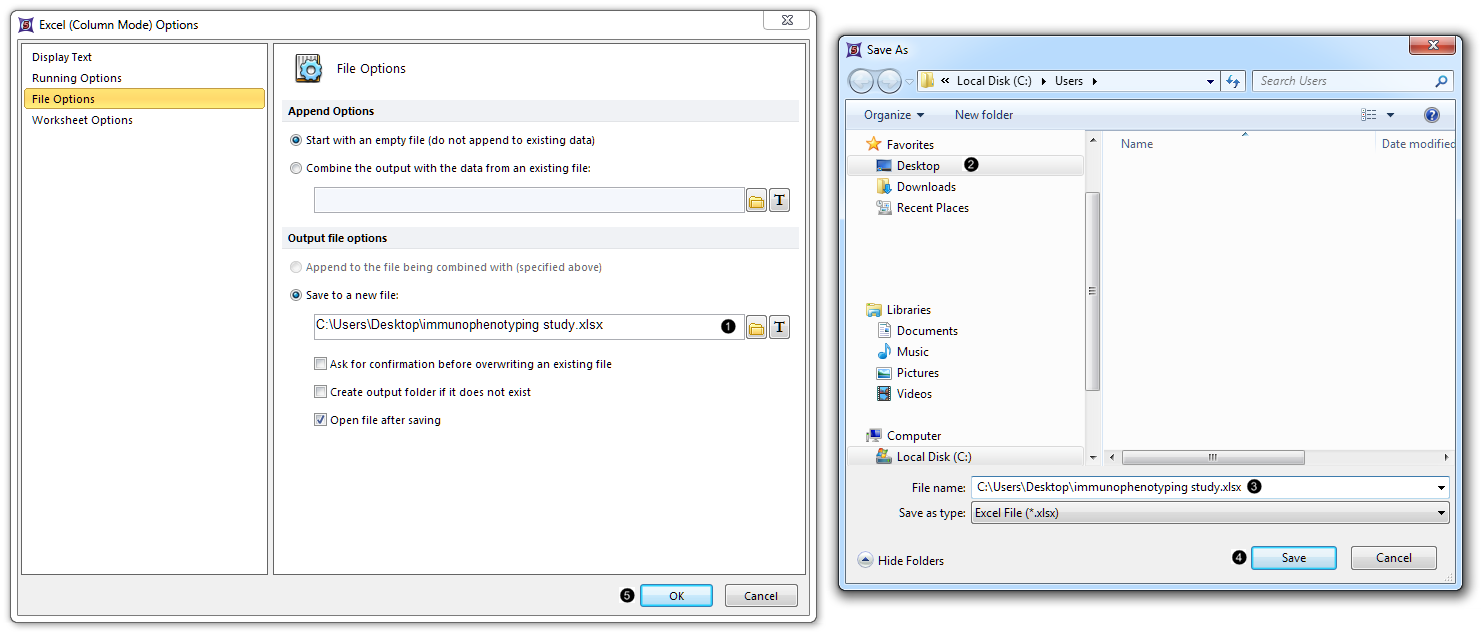
Figure T29.40 Adding an Excel (Column Mode) report to Batch Process Actions
| 15. | 航到导出文件保存位置的目录文件夹,例如桌面,在Save As(保存为)对话框窗口(图T29.40 )。 )。 |
| 16. | 在File name(文件名)处输入"immunophenotyping study"(图T29.40 )。 )。 |
| 17. | 点击Save(保存)(图T29.40 )。 )。 |
| 18. | 在Excel (Column Mode) Options(Excel(列模式)选项)对话框中点击OK(图T29.40, )。 )。 |
我们现在将选择Excel报表中将包含的标记类型。
| 19. | 点击版面右下角的文本表格,此时其边框将高亮显示(图T29.41 )。 )。 |
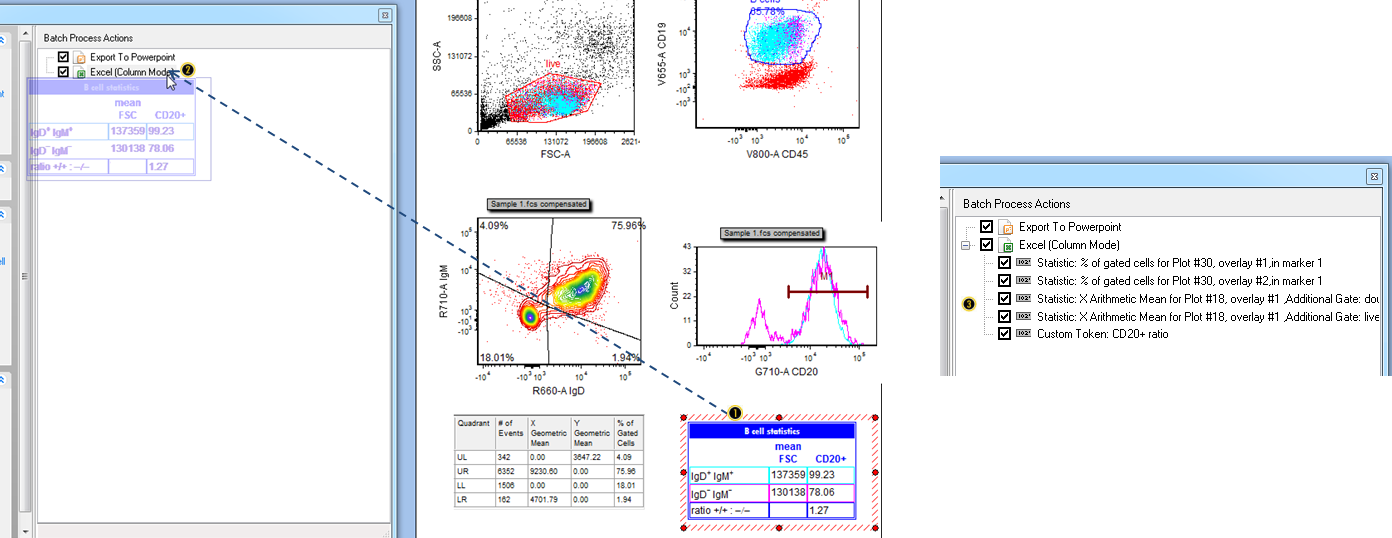
Figure T29.41 Dragging and dropping the tokens within a text table into the Excel export in the Batch Process Actions window.
(Note: the layout pictured has had the optional steps completed for adding red outlier dots to the contour plot, and for normalizing the histogram. If you are using your own layout from the previous section and skipped those steps, those two plots will look slightly different.)
| 20. | 拖拽文本表格到batch actions(批操作)窗口,同时按住鼠标左键不放。 |
| 21. | 当光标位于Batch Process Actions(批处理操作)列表的Excel (Column Mode) (Excel(列模式))中时,松开鼠标(图T29.41 )。 您可能会注意到,当您松开鼠标钱,一个虚浮的列表会出现在Batch Process Actions(批处理操作)中。此时,文本表格中所有的统计标记都被添加到Excel (Column Mode) (Excel(列模式))报表中(图T29.41 )。 您可能会注意到,当您松开鼠标钱,一个虚浮的列表会出现在Batch Process Actions(批处理操作)中。此时,文本表格中所有的统计标记都被添加到Excel (Column Mode) (Excel(列模式))报表中(图T29.41 )。 )。 |
注意: 通过拖拽绘图元素,包括门、文本框中的门/标识/象限及整个绘图,用户可添加标记到您的Excel报表中, 您也可用这种方式来添加默认统计窗口中的个体标记和文本表格。我们现在通过拖拽绘图,来增加一个标记到 报表中。
| 22. | 点击版面左上角的绘图,它的边框将高亮显示,证明其被选中(图T29.42, )。 )。 |
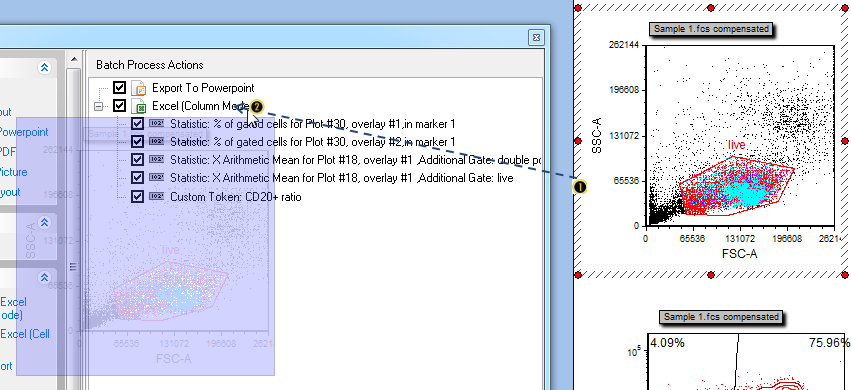
Figure T29.42 Dragging and dropping a plot-derived element into the Excel export of the Batch Process Actions window
| 23. | 拖拽绘图到Batch actions(批操作)窗口,同时按住鼠标左键不放。 |
| 24. | 当光标位于Batch Process Actions(批处理操作)列表的Excel (Column Mode) (Excel(列模式))图标处,松开鼠标(图T29.42, )。 您可能会注意到,当您松开鼠标钱,一个虚浮的绘图会出现在Batch Process Actions(批处理操作)中。 )。 您可能会注意到,当您松开鼠标钱,一个虚浮的绘图会出现在Batch Process Actions(批处理操作)中。 |
| 25. | 在Paste Special(特殊粘贴)对话框中点击Keyword Token(关键字标记)(图T29.43, )。 )。 |
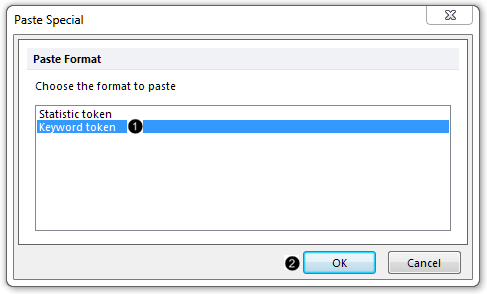
Figure T29.43 Selecting a keyword token
| 26. | 点击OK(图T29.43, )。 )。 |
| 27. | 点击Select a keyword(选择一关键字)对话框中的省略号(图T29.44, )。 )。 |
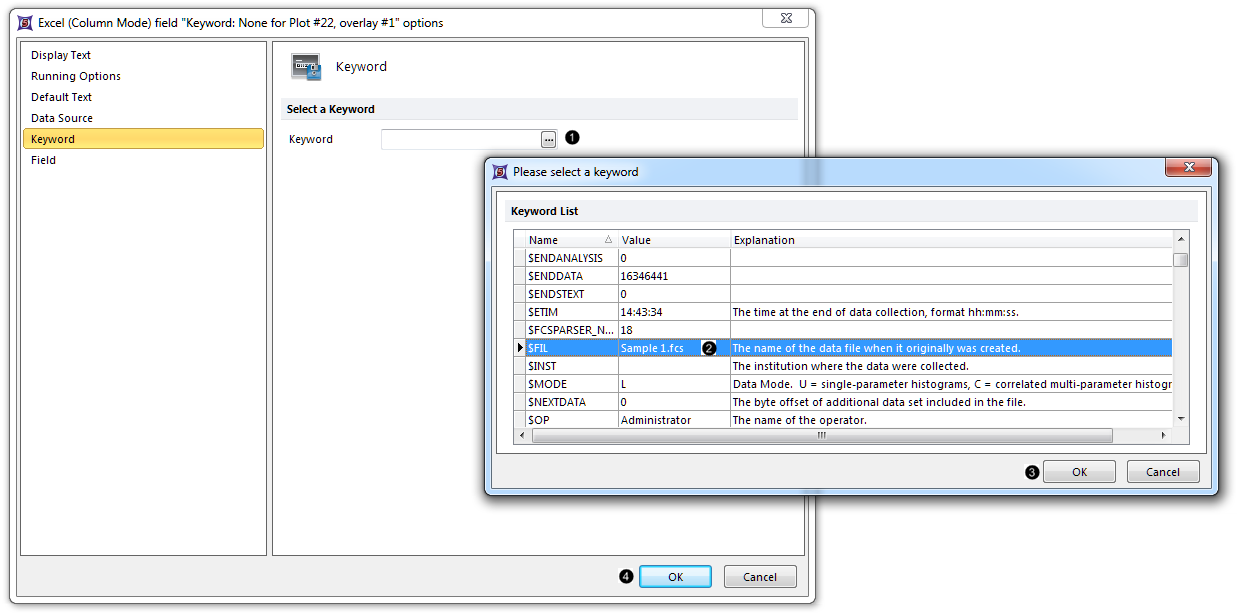
Figure T29.44 Selecting a specific keyword token
| 28. | 在Please select a keyword (请选择一个关键字)对话框中滚动到$FIL处,然后将其选中(图T29.44, )。 )。 |
| 29. | 在Please select a keyword (请选择一个关键字)对话框中点击OK(图T29.44, )。 )。 |
| 30. | 在Excel (Column Mode) field "Keyword..."(Excel(单元格模式)"关键字"字段选项)对话框中点击OK(图T29.44, )。 )。 |
现在,多个statistical(统计数据)和Keyword Tokens(关键字标记) 已经 导出到Excel中。我们将重排列表顺序,因此Keyword Tokens(关键字标记) 将导出到您 Excel工作表的第一列。
| 31. | 按住“Keyword: $FIL for Plot#...”标记不放 (图T29.45所示。 )。 )。 |

Figure T29.45 Reordering the tokens in the list to be exported to Excel
| 32. | 拖拽该 标记到Excel (Column Mode) (Excel(列模式))图标的下方(图T29.45所示。 )。 )。 |
| 33. | 当蓝色条形跨越了窗口宽度后,松开鼠标,位置如图T29.45所示。 现在,标记被重排,如图T29.45所示右边。注意:列表中,如果 标记没有移动到新的位置,请加大Batch Process Actions(批处理操作)窗口的宽度(直接拖拽边框即可,因此每个标记描述符后都有一块空白区域),然后再试一次。 现在,标记被重排,如图T29.45所示右边。注意:列表中,如果 标记没有移动到新的位置,请加大Batch Process Actions(批处理操作)窗口的宽度(直接拖拽边框即可,因此每个标记描述符后都有一块空白区域),然后再试一次。 |
虽然我们现在准备开始Batch Processing(批处理) 我们的分析,但开始之前我们先查看一下在版面中的、所有的样本。这在FCS Express中可轻松完成,不需要对每个我们的样本制作副本绘图和表格。因为,在FCS Express中,"What you see is what you get(您看见的就是您可得到的)", 所以您甚至可以打印整个版面或者添加一个打印操作到Batch Process Actions(批处理操作)列表中,然后打印输出的结果将与屏幕上的版面几乎完全一样。
| 34. | 选择Data(数据)标签→Organize Data Sets(组织数据集)→Data List(数据列表)(图T29.46,左边)。此时,Data List(数据列表)出现了(图T29.46,右边),它包含有来自目录文件夹、从"Sample 1.fcs" 开始的4个.fcs格式文件。当我们运行批处理时,会有4个循环,我们将得到含有4张幻灯片的PowerPoint文件和4行数据的Excel报表。 |
注意:如果您想要定义一个.fcs文件格式的列表,然后以您的分析开始工作,那在创建您的版面钱,您可以先将您的文件添加到数据列表中。该教程中,我们可轻松将"Sample 1.fcs"加载到我们的绘图中,并将目录文件夹中其他3个文件加自动载到 数据列表中。
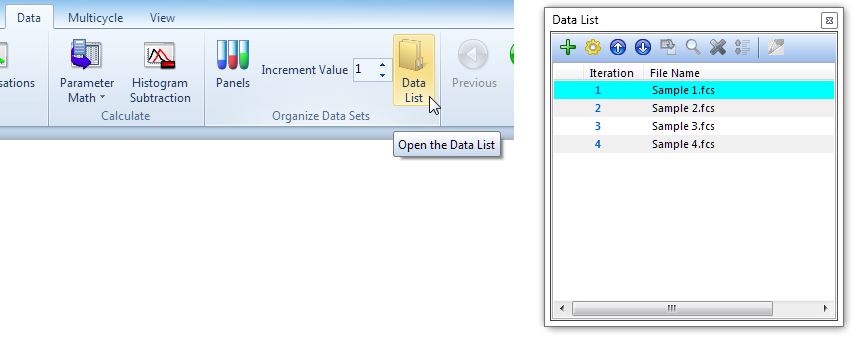
Figure T29.46 Opening the Data List
| 35. | 选择Data(数据)标签→Change Data on All Objects(修改所有对象上的数据)→Next(下一步)(图T29.47)。当每次点击Next(下一步)时,版面中的绘图和统计表格将更新到下一个文件。当"Sample 4.fcs"显示于绘图中时,就不能在点击Next(下一步)了,因为这是数据列表中的最后一个文件。 |
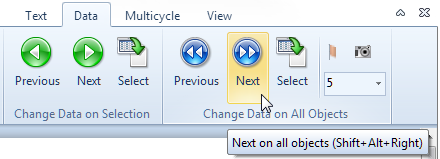
Figure T29.47 Changing data on all objects to the next iteration in the Data List
| 36. | 点击Data(数据)标签→Change Data on All Objects(修改所有对象上的数据) →Previous(前一步)(图T29.47,在Next(下一步)的左边),直到"Sample 1.fcs"重新显示在版面中为止。 |
当您点击Next(下一步)来让您的进入到Data List(数据列表)中的下一个数据时,您可能会注意到群体位置有移动,因此您会想要调整门、标识或者象限到一个合适位置。现在,我们会在 Batch Options(批处理选项) 中,在我们的 循环间增加一个暂停,这样,软件将会在输出每个样本数据之前暂停。这一暂停,允许我们在生成该样本PowerPoint和Excel报表前,在"Sample 2.fcs"调整"B cells"门(举例),完成后版面才会进入"Sample 3.fcs"循环中。注意:如果批处理时,FCS Express版面在每个循环间无需调整,那您就不用进入Batch Options(批处理选项)(描述在第41-44步和46-48步)。
| 37. | 选择Batch(批处理)标签→Batch Processing(批处理)→Options(选项)(图T29.48)。 |
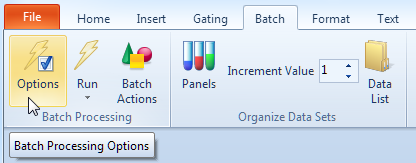
Figure T29.48 Accessing Batch Processing Options
| 38. | 在Batch Processing Options(批处理选项)对话框中选中unconditionally pause between each iteration(无条件的在循环间暂停)(图T29.49 )。 )。 |
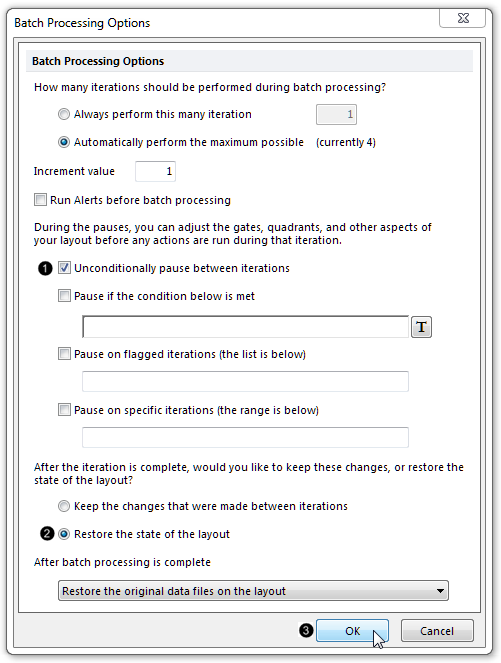
Figure T29.49 Adding a pause between iterations to our batch process
| 39. | 点击Restore the state of the (恢复版面的状态)单选按钮(图T29.49 )。 )。 |
| 40. | 点击OK(图T29.49 )。 )。 |
| 41. | 选择Batch(批处理)标签→Batch Processing(批处理)→Run(运行)(图T29.50)。 |
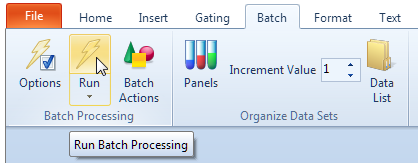
Figure T29.50 Running the batch process
此时,Batch Processing(批处理)状态窗口将出现(图T29.51),表明数据列表中的1-4的迭代已经通过2 of 2操作(i.e., one PowerPoint slide(一张PowerPoint幻灯片) +one Excel row of statistics(一行Excel统计))完成。
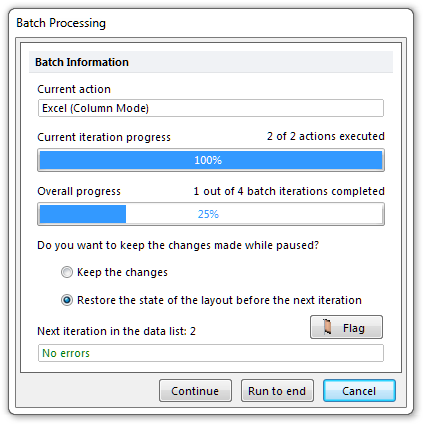
Figure T29.51 Status of the batch process (currently in progress)
| 42. | 调整等高线绘图中的"B cells"门、象限和/或标识"M1"的位置。这一暂停中,您也可以对您版面做其他更改,例如重新调节绘图的轴线、重设格式、添加或者删除绘图、文本框或其他任何对象。 |
| 43. | 点击Continue(继续)(在窗口的底部,展示于图T29.51)。 |
| 44. | 重新进行第42-43步骤,直到批处理完成;或者在无需再做任何更改的情况下,点击Run to end(运行到底)(在窗口的底部,展示于图T29.51)。 |
| 45. | 检查您的PowerPoint报告,这4张幻灯片看上去与您FCS Express执行分析后的版面很像,且对门、标识和象限的调整也记录在幻灯片中。幻灯片上的每个绘图和统计窗口,是作为高分辨率对象导出的,可以根据用户需要移动和调节大小。注意:该版面的一个PowerPoint报告被保存到教程样本数据库中的"Immunophenotyping Tutorial"文件夹下。 |
| 46. | 检查您的Excel报表,注意,针对每个样本导出的统计数据反应的是调整后的门、标识和象限,它们也同样记录在Powerpoint报告中。注意:该版面的一个Excel报表被保存到教程样本数据库中的"Immunophenotyping Tutorial"文件夹下。 |
本教程附带View the Immunophenotyping Analysis(查看Immunophenotyping分析)的网络讲座记录。


