与回归标记和拟合方程一起工作
我们将在带有回归分析的散点图上展示一个回归标记。
| 1. | 请右键点击带回归分析的散点图,从弹出菜单中选择Add text box (添加文本框)(图T27.8 |
| 2. | 右键点击绘图上的文本框,从弹出菜单中选择Insert Token(插入标记)(图T27.8 |
| 3. | 双击Insert a Token(插入一个标记)对话框中的Statistic(统计)(图T27.8 |
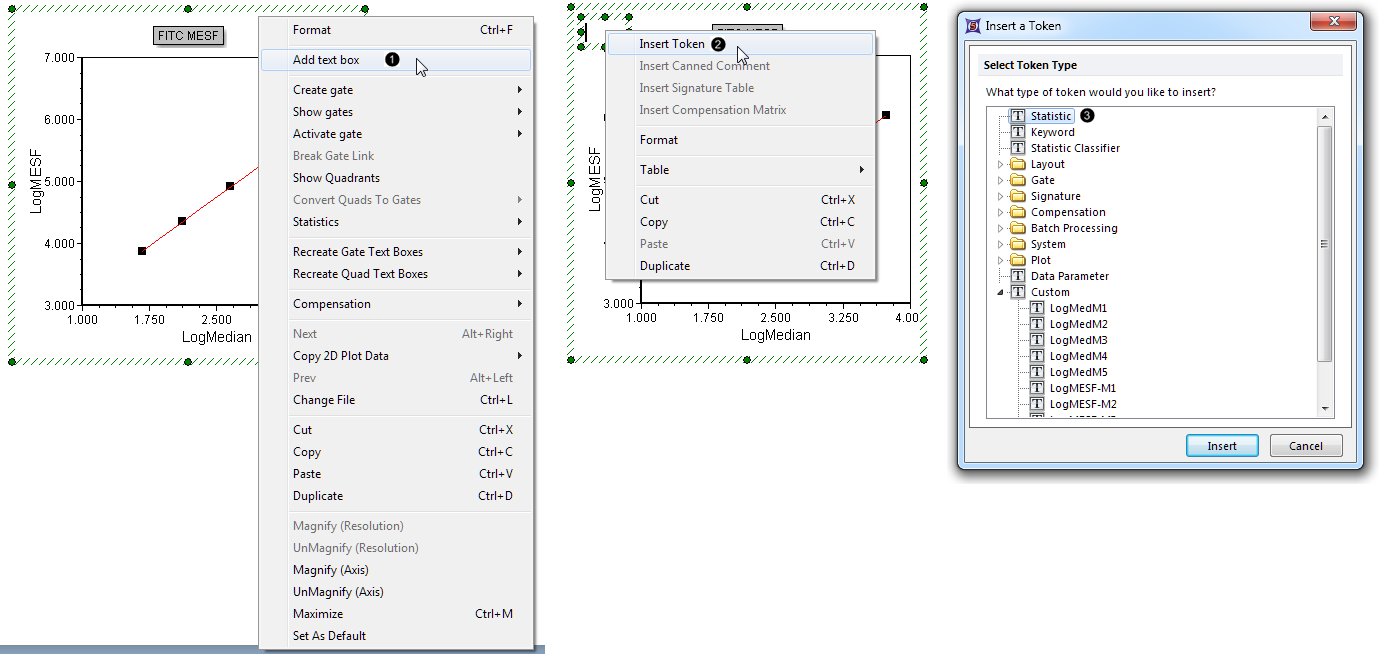
Figure 27.8 Adding a regression token to the plot
| 4. | 点击Create Statistic(创建统计)对话框中的Statistic(统计)项目类别(图T27.9 |
| 5. | 从Select a Statistic(选择一个统计)下拉菜单中选择Regression Parameter Statistics(回归参数统计)(图T27.9 |
| 6. | 从Statistic(统计)列表中选择“m”(斜率)(图T27.9 |
| 7. | 把Number of Decimals(小数位数)增加到“4”(图T27.9 |
| 8. | 点击OK(图T27.9 |
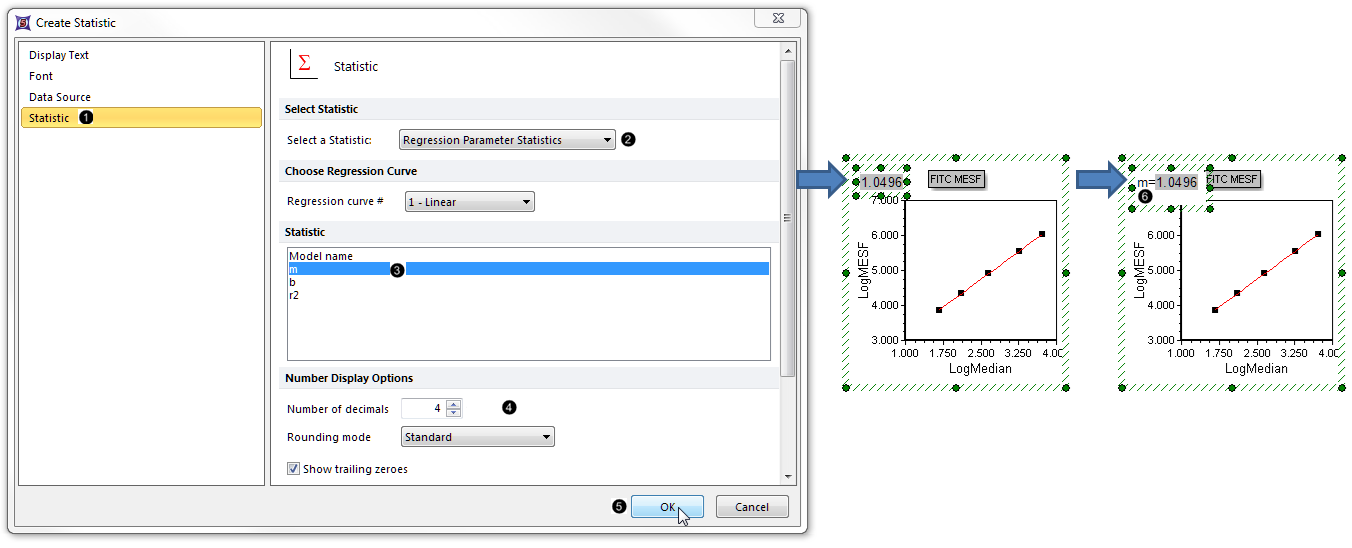
Figure 27.9. Adding a regression token to the plot, continued
| 9. | 在文本框中点击鼠标左键,让其进入编辑模式。文本框的边框将变为绿色。 |
| 10. | 使用键盘上的方向键或者直接在文本框中点击,来移动光标到标记的左边。 |
| 11. | 输入“m =”(图T27.9 |
我们现在来为线性回归方程创建一个自定义标记,这样的话,我们就可将这一回归分析应用到其他.fcs文件中(包括其他版面中的文件)。在Regression Parameter Statistics list(回归参数统计列表)中的每个标记(图27.9)都将被用作为此自定义标记的元件。
| 12. | 点击 |
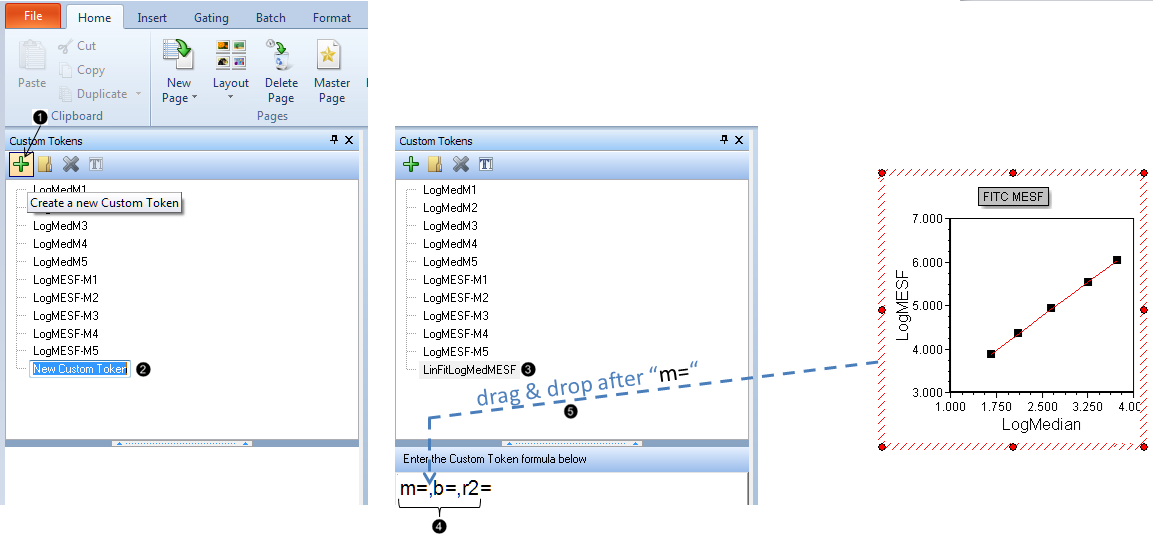
Figure T27.10 Creating the Linear Regression Fit Custom Token
| 13. | 高亮显示自定义标记窗口中的"New Custom Token(新自定义标记)"文本(图27.10 |
| 14. | 请键入"LinFitLogMedMESF"(图27.10 |
| 15. | 在自定义标记窗口的公式(靠下方)格中输入"m=,b=,r2="(图27.10 |
| 16. | 点击带回归分析的散点图,其边框将高亮显示。 |
| 17. | 拖拽带回归分析散点图的边框到自定义标记窗口公式格中"m="之前、"," 之后的位置(图27.10 |
| 18. | 双击Paste Special(选择性粘贴)对话框中的Statistic token(统计标记)(图27.11 |
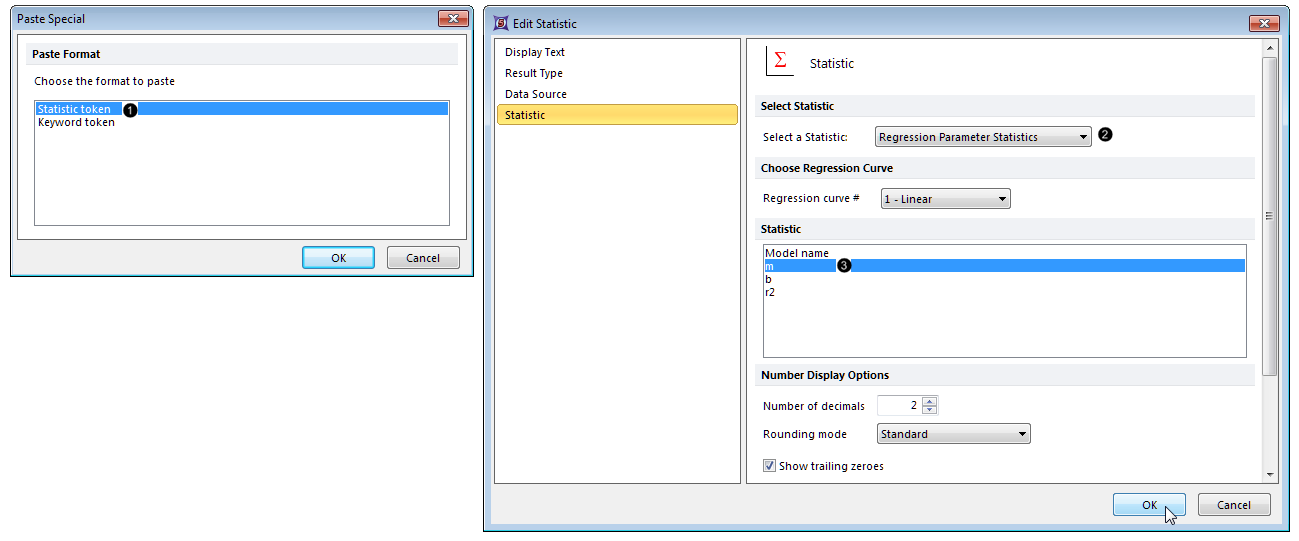
Figure 27.11 Inserting a regression parameter token as a component of the linear regression fit custom token
| 19. | 从Select a Statistic(选择一个统计)下拉菜单中选择Regression Parameter Statistics(回归参数统计)(图27.11 |
| 20. | 从Statistic(统计)列表中选择“m”(图27.11 |
| 21. | 点击OK。 |
| 22. | 重复17-21步骤,进行以下修改: |
| • | 第17步:将散点图放在自定义标记窗口公式格的"b="之后 |
| • | 第20步:从Statistic(统计)列表中选择“b” |
| 23. | 重复17-21步骤,进行以下修改: |
| • | 第17步:将散点图放在自定义标记窗口公式格的"r2="之后 |
| • | 第20步:从Statistic(统计)列表中选择"r2" |
| 24. | 请把LinFitLogMedMESF自定义标记从Custom Tokens(自定义标记)窗口上拖拽到版面上的一块空白区处。一个包含linear regression fit token(线性回归拟合标记)的新的文本框将自动创建。 |
注意:一“r2”值为1,证明拟合很完美,但很难得到这样准确的实验数据。自定义标记最初展示的“r2”值是1.00,因此它在此处的值大于0.995,且FCS Express中的statistics(统计)中默认的是两位小数。
我们现在将编辑Custom Token(自定义标记)中的 “r2”元件,让其能够显示小数点后5位。
| 25. | 双击自定义标记窗口公式格中的“r2”元件(图27.12 |
| 26. | 点击Edit Statistic(编辑统计)对话框中的Statistic(统计)项目类别(图27.12 |
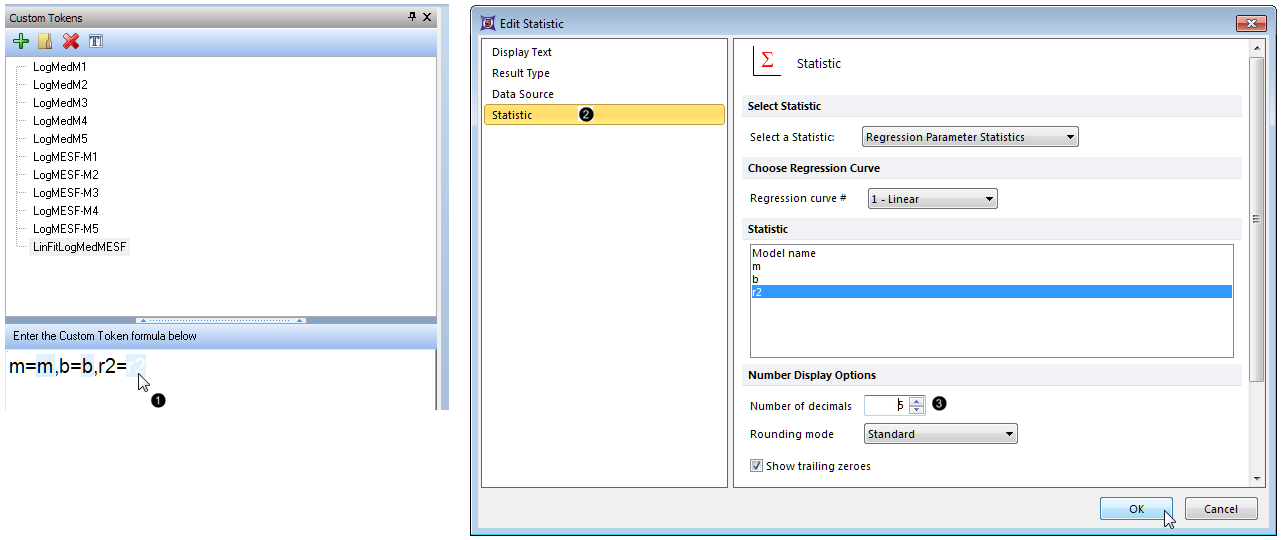
Figure 27.12 Increasing the number of digits after the decimal displayed for the r-squared component of the Custom Token
| 27. | 把Number of Decimals(小数位数)增加到5(图27.12 |
| 28. | 点击OK。 |
线性拟合标记显示于T27.13中。

Figure T27.13 The LinFitLogMedMESF Custom Token displayed in a Text Box, after editing the number of digits displayed for r-squared
在下一节中,我们将创建一个线性拟合叠加图层在散点图中。
