创建散布图
| 1. | 请选择File(文件)标签→Open(打开)。 |
此版面包括彩色点状图和一个自定义数据网格,散布图将由该自定义数据网格中的数据得到(图22)。要了解如何在版面中添加自定义数据网格,请参见“在版面中添加自定义数据网格”章节。
我们现在将用自由文本和实时更新标记对自定义数据网格进行填充。首先,我们将为散布图输入相互独立的参数。注意:与条形图和饼状图相比,散布图的x轴值必须是数字。我们将输入hours of treatment(治疗时间)来作为x轴参数,它也是每个彩色点状图的标题。
| 3. | 在自定义数据网格中点击A1单元格(图22 |
| 4. | 请在自定义数据网格公式编辑器中输入"0"(图22 |
| 5. | 点击自定义数据网格公式编辑器中的绿色复选标记(图22 |
| 6. | 针对自定义数据网格中的A2和A3单元格,重复第3-4步,分别输入"6"和"12"。此时,自定义数据网格看上去如图22所示。 |
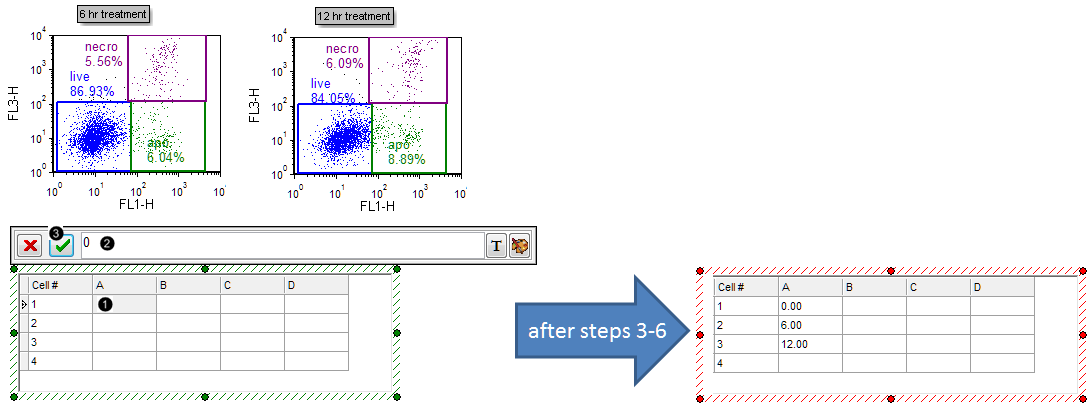
Figure 22. Typing freetext into a Custom Data Grid
| 我们现在将在自定义数据网格中插入标记,从而让其展示于散布图上。 |
| 7. | 请从“6 hr treatment”绘图中拖拽"live"门到自定义数据网格的B2单元格中。拖拽时,该门的边框将移动(图23 |
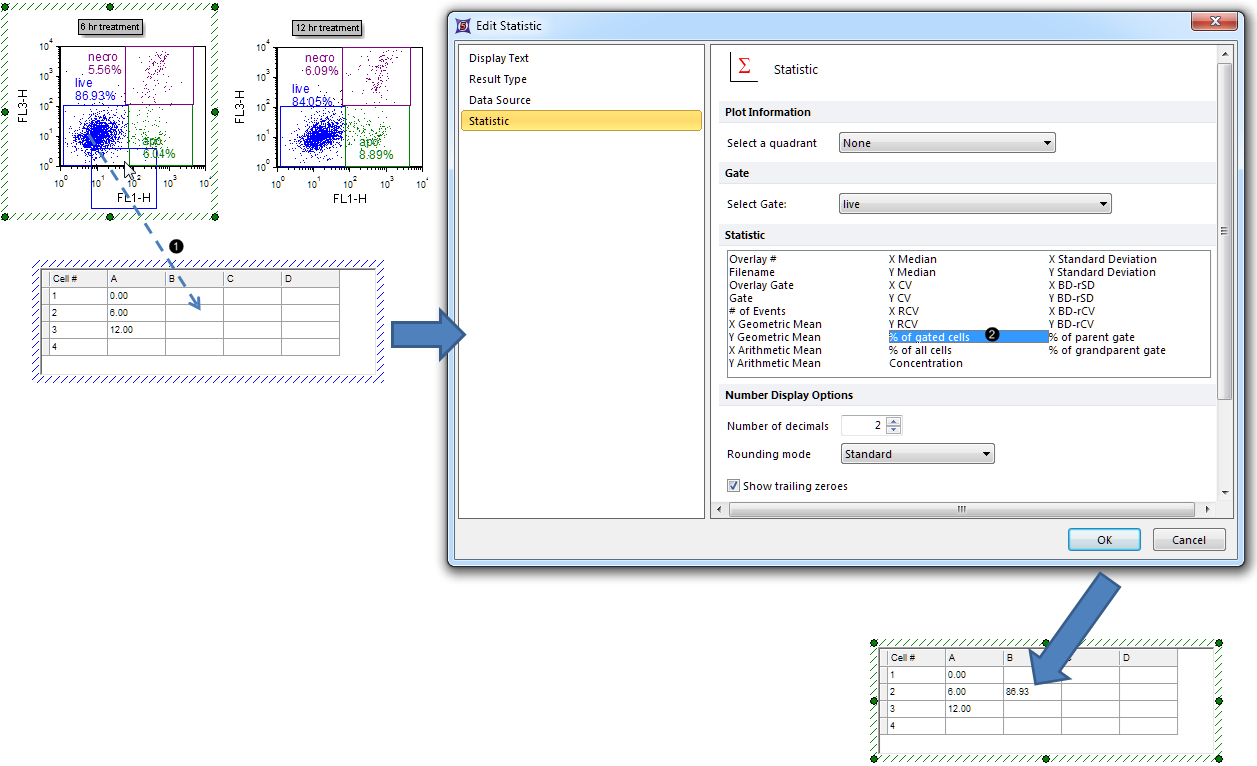
Figure 23. Dragging and dropping a statistic token into a Custom Data Grid
| 8. | 请从Edit Statistic(编辑统计)对话框中的Statistic(统计)列表框中选择“% of gated cells(门中细胞百分比)”(图23 |
| 9. | 点击OK。现在,自定义数据网格的B2单元格就包含了来自“6 hr treatment”彩色点状图的“"live"门的“% of gated cells(门中细胞百分比)”(图23所示)。 |
| 10. | 请针对“12 hr treatment”和“Control (no treatment)”彩色点状图,重复第7-9步骤,请将这两个绘图上的"live"门分别拖拽到B1和B3单元格。此时,自定义数据网格看上去如图24所示。 |
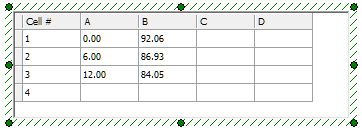
Figure 24. Completed Custom Data Grid
| 11. | 请选择Insert(插入)标签→ 1D Plots(一维绘图)→ Scatter(散布图)命令(图25)。 |

Figure 25. Inserting a Scatter Plot
| 12. | 在版面上一空白处点击(例如在自定义数据网格的右边点击)来插入散布图。 |
| 13. | 点击"A"列种的任何一个单元格,将其选中。 |
| 14. | 右键点击自定义数据网格的"A"列(图26)。 |
| 15. | 从弹出菜单中选择Rename Selected Column(为所选列重命名)(图26 |
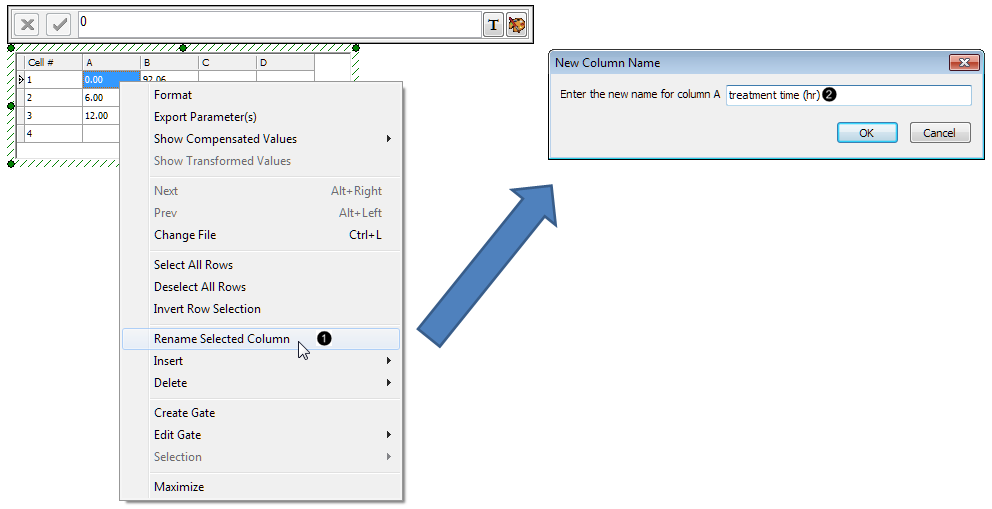
Figure 26. Renaming a column in the Custom Data Grid
| 16. | 请在New Column Name(新列名)对话框中输入"treatment time (治疗时间)(hr)"(图26 |
| 17. | 点击OK。 |
| 18. | 针对"B"列重复第14-17步骤,为散布图的Y-轴输入"%-gated"来重命名。此时,散布图和与此关联的自定义数据网格将如图27所示。 |
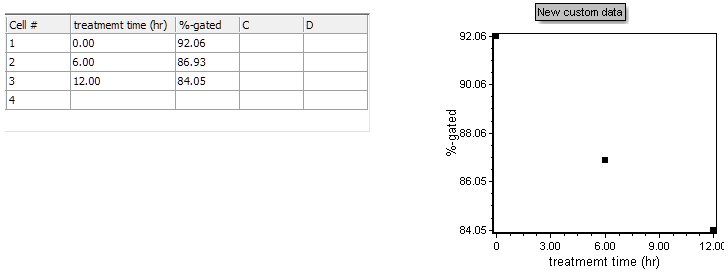
Figure 27. Custom Data Grid with retitled columns and associated Scatter Plot
我们现在将调整散布图的位置,让其上面的点更容易看到。
| 19. | 右键点击散布图,从弹出菜单中选择Formatting(格式化)对话框。 |
| 20. | 选择Axis(坐标轴)项目类别(图28 |
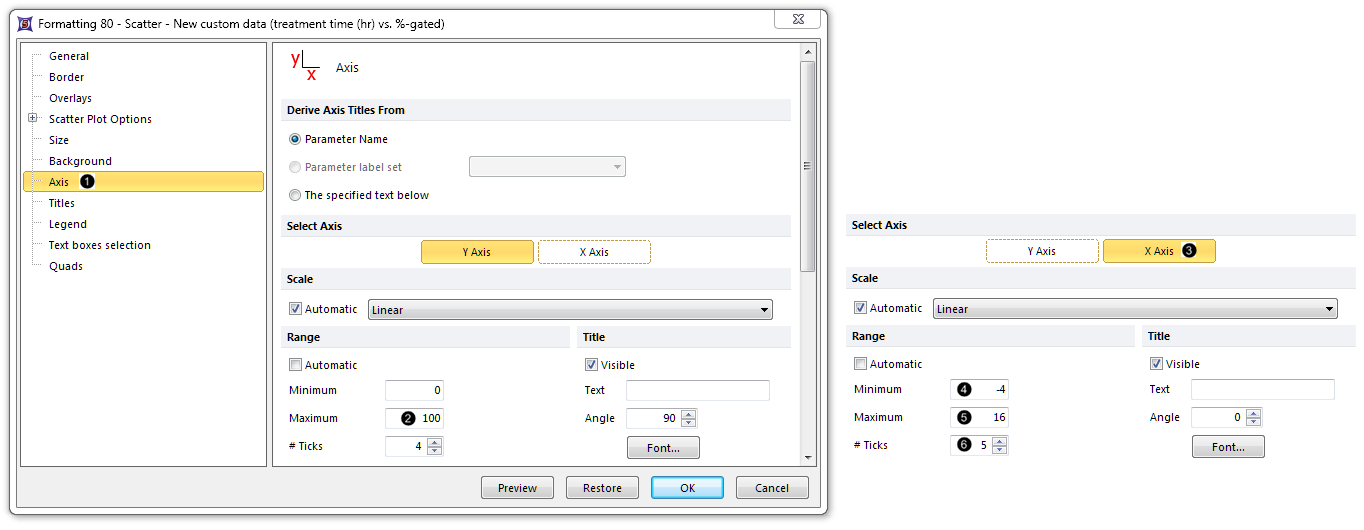
Figure 28. Adjusting range of the Scatter Plot from the Formatting dialog
| 21. | 输入"100"作为Maximum(最大值)(图28 |
| 22. | 请点击Select Axis(选择坐标轴)部分的X-axis(X-坐标轴)(图28 |
| 23. | 输入 "-4"作为Minimum(最小值)(图28 |
| 24. | 输入 "16"作为Minimum(最小值)(图28 |
| 25. | 请把# Ticks(刻度)增加到“5”(图28 |
| 26. | 点击OK。 |
此时,该散布图将如图28所示。
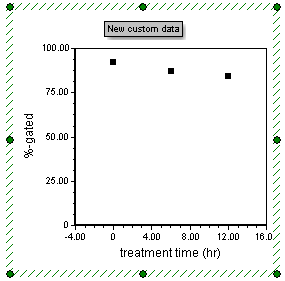
Figure 29. Completed Scatter Plot with adjusted range
注意:散布图中,点的颜色、形状、连接线及其他属性,用户都可以进行自定义。要了解更多详细信息,请参见“格式化散点图”章节。
| 27. | 自选操作: |
| • | 点击Data(数据)标签→Change Data on All(修改所有数据)→ Next/Previous(下一项/前一项)按钮来向前发展,主要是设置Data List(数据列表)中的文件及观看散布图新数据的更新。 |
| • | 对彩色点状图上的门进行调整,来观看散布图的实时更新。 |
