门导航器功能
如图T13.7所示,Gate Navigator(门导航器)是根据版面中使用的门来进行组织的。在每个门下,是应用该门的一个绘图列表。将光标移到Gate Navigator(门导航器)中的绘图上时,会出现这些绘图的缩略图。这是一个快捷的查看哪个绘图应用哪个门的方法(特别是在绘图不处在可见状态时)。
现在,我们将探讨Gate Navigator(门导航器)的功能,让我们从使用Gate Navigator(门导航器)把一个门应用于一个绘图开始。具体地说,我们将把CD3门以及FL2+门先后应用到版面中的二维绘图上。
| 1. | 将光标放在Gate Navigator(门导航器)中的CD3门上,如图T13.8中的蓝色高亮所示。 |
| 2. | 按下鼠标左键不放。 |
| 3. | 拖拽CD3门到版面上。 |
| 4. | 当把CD3门拖到版面中左栏第二行的二维密度图CD3-FITC(FITC fluorescence vs.SSC-H)上时,请松开鼠标(如图T13.8中的蓝色轮廓线和光标所示)。 |
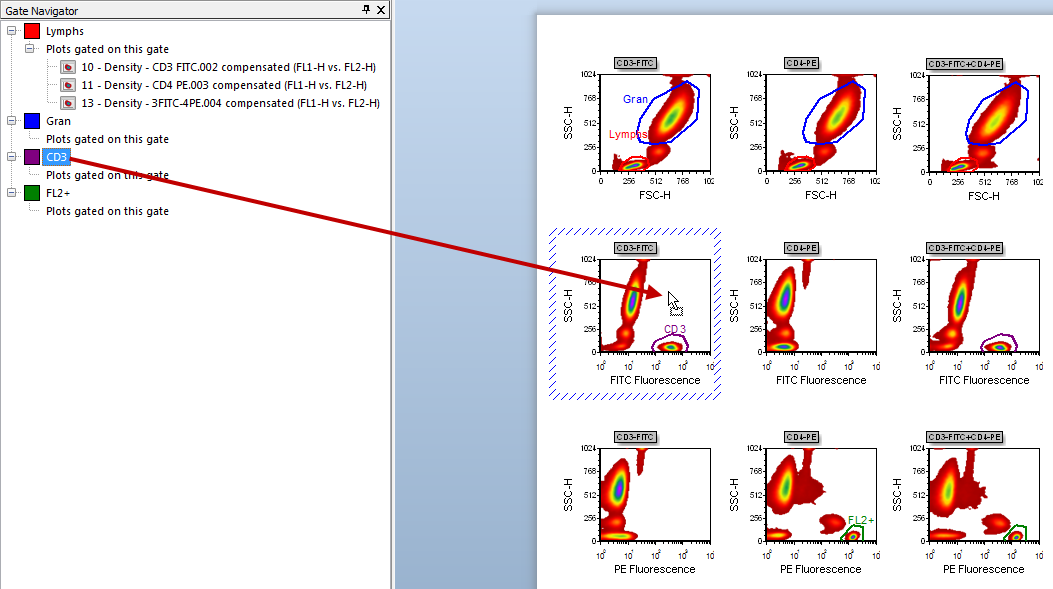
Figure T13.8 Dragging and Dropping the CD3 Gate from the Gate Navigator onto a Density Plot on the Layout
二维密度图CD3-FITC(FITC fluorescence vs.SSC-H)会自动更新,来反映它已经应用了CD3门,如图T13.9所示。同时,Gate Navigator(门导航器)也进行了更新,在CD3门下方,会出现一新的二维密度图CD3-FITC (FL1-H vs.SSC-H)列表,如图T13.9中的光标和缩略图所示。
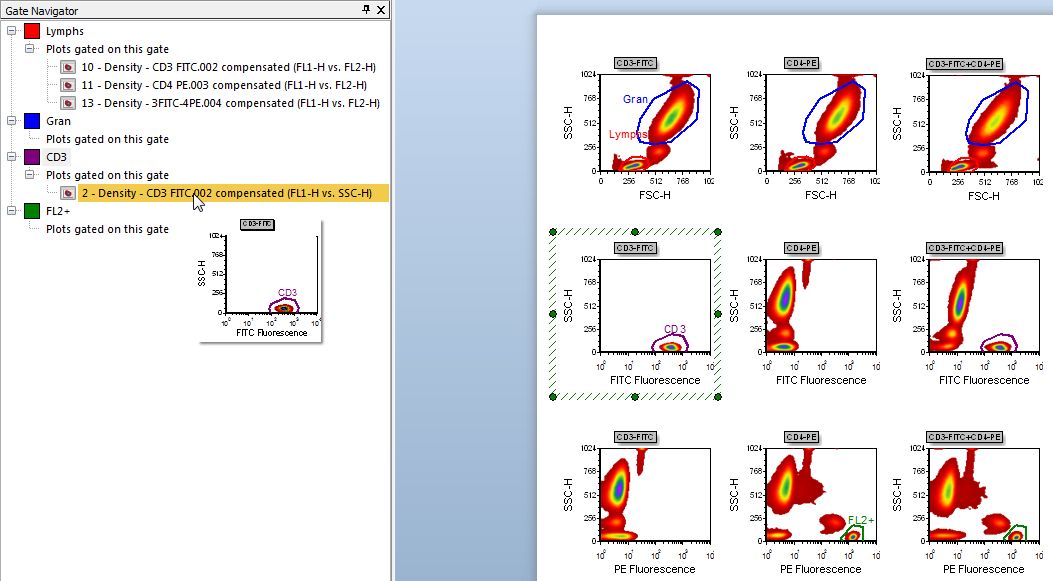
Figure T13.9 Application of the CD3 Gate to the 2D Density Plot of CD3-FITC (FL1-H vs. SSC-H)
我们现在要使用拖放操作,把CD3门,从Gate Navigator(门导航器)中,应用到版面上其它的FITC Fluorescence vs.SSC-H二维绘图中。
| 5. | 请重复第1步到第3步。 |
| 6. | 当CD3门在版面上中间列第二行的二维密度图CD4-PE (FITC fluorescence vs.SSC-H)上时,请松开鼠标。 |
这时,二维绘图和Gate Navigator(门导航器)同时进行了更新,来反映CD3门被应用到绘图CD4-PE (FITC Fluorescence vs.SSC-H)上,如图T13.10所示。
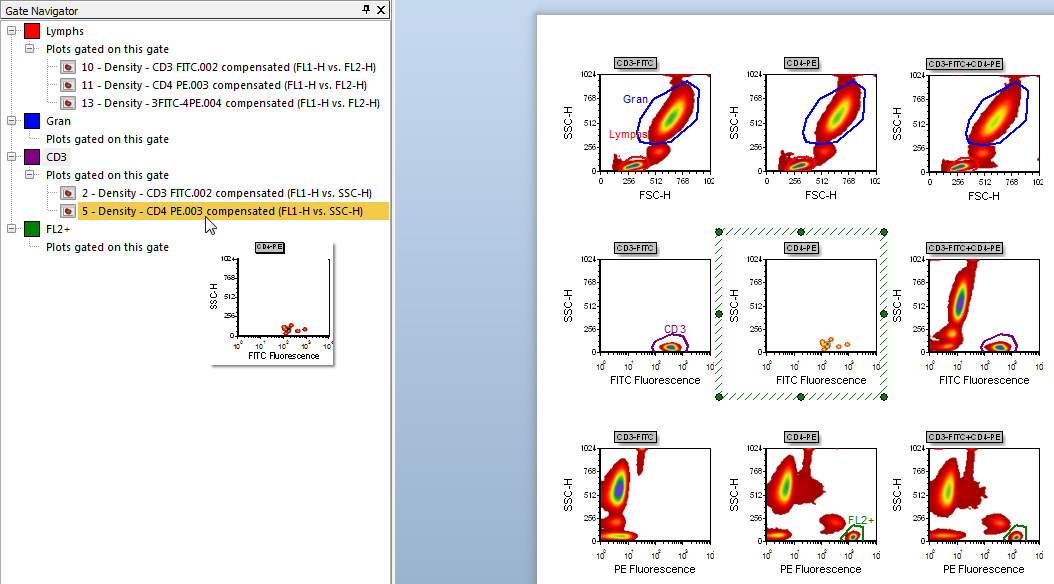
Figure T13.10 Application of the CD3 Gate to the 2D Density Plot of CD4-PE (FL1-H vs. SSC-H)
| 7. | 请重复第1步到第3步。 |
| 8. | 当CD3门被拖到版面中第二行最后一列的二维绘图CD3-FITC+CD4-PE (FITC fluorescence vs.SSC-H)上时,请松开鼠标。 |
这时,二维绘图和Gate Navigator(门导航器)同时进行了更新,来反映CD3门被应用到了绘图CD3-FITC+CD4-PE (FITC fluorescence vs.SSC-H)上,如图T13.11所示。
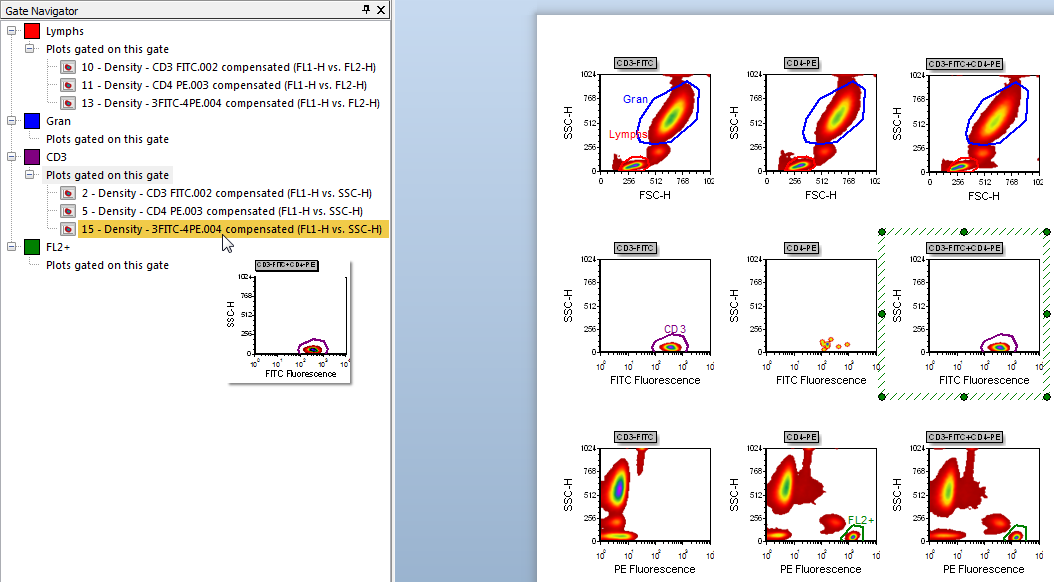
Figure T13.11 Application of the CD3 Gate to the 2D Density Plot of CD3-FITC+CD4-PE (FL1-H vs. SSC-H)
接下来,我们将把FL2+门到版面中第三行的二维绘图PE Fluorescence vs.SSC-H上。
| 9. | 将光标放在Gate Navigator(门导航器)中的FL2+门上。 |
| 10. | 按下鼠标左键不放。 |
| 11. | 将FL2+门拖拽到版面上。 |
| 12. | 当把FL2+门拖到版面上第三行第一列的二维密度图CD3-FITC (PE fluorescence vs.SSC-H)上时,松开鼠标。 |
这时,二维绘图和Gate Navigator(门导航器)同时进行了更新,来反映FL2+门被应用到绘图CD3-FITC (PE Fluorescence vs.SSC-H)上。接下来,我们将把FL2+门应用到其它PE Fluorescence vs.SSC-H二维绘图上。
| 13. | 请重复第9步到第11步。 |
| 14. | 当把FL2+门拖拽到版面上第三行中间一列的二维密度图CD4-PE (PE fluorescence vs.SSC-H)上时,请松开鼠标。 |
| 15. | 请重复第9步到第11步。 |
| 16. | 当把FL2+门拖拽到版面上第三行右边列的二维密度图CD3-FITC+CD4-PE (PE fluorescence vs.SSC-H)上时,请松开鼠标。 |
现在,版面上的二维绘图和Gate Navigator(门导航器)看起来应如图T3.12所示。
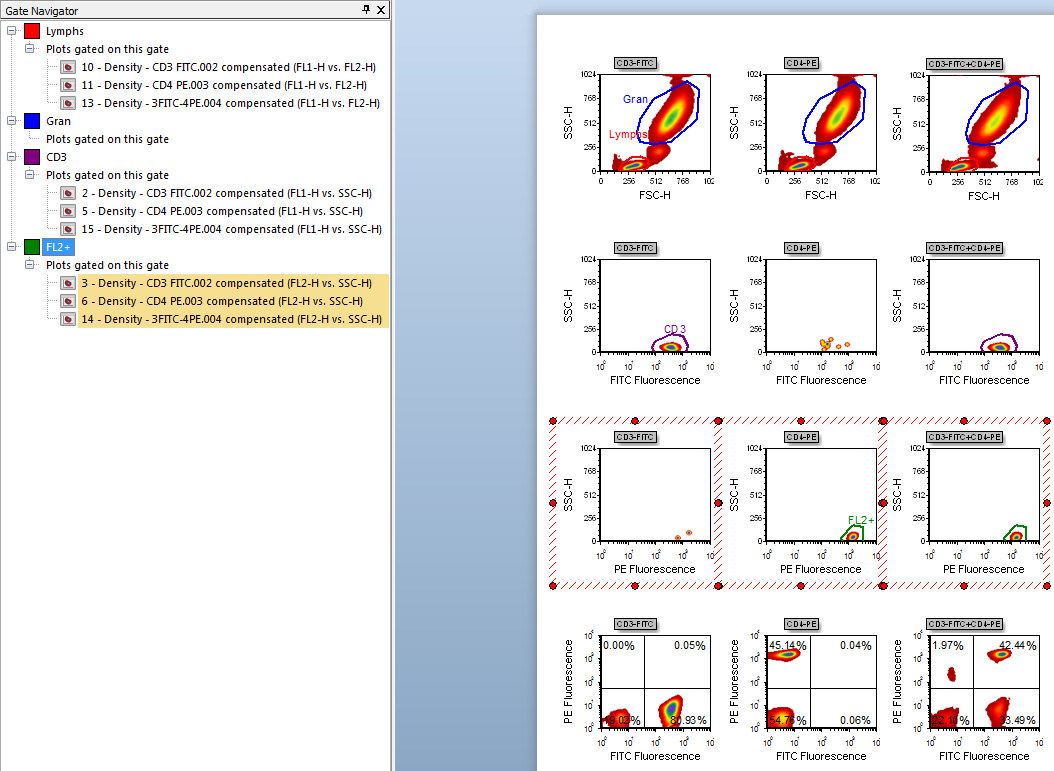
Figure T13.12 2D Plots and Gate Navigator Updated to Reflect the Application of Gates
既然我们有这么多的使用门的二维绘图,那我们可以在Gate Navigator(门导航器)上,对门进行拖放来修改哪些绘图使用哪个门。接下来,我们将把Lymphs(淋巴细胞)门应用到正在使用CD3CD3门的二维绘图上,仅通过Gate Navigator(门导航器)的方法。
| 17. | 请把光标放在Lymphs(淋巴细胞)门上,如图T13.13中的蓝色高亮所示。 |
| 18. | 按下鼠标左键不放。 |
| 19. | 请在Gate Navigator(门导航器)上把Lymphs(淋巴细胞)门向下拖。 |
| 20. | 当把Lymphs(淋巴细胞)门拖拽到2 - Density - CD3 FITC.002 compensated (FL1-H vs.SSC-H)列表的上方时,请松开鼠标,如图T13.13中的光标和蓝色高亮所示。 |
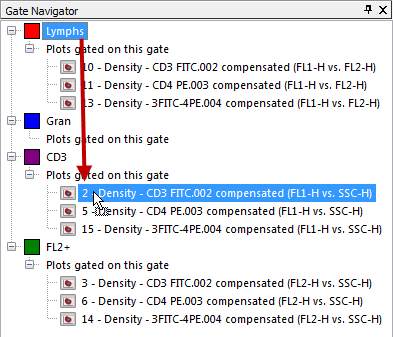
Figure T13.13 Dragging and Dropping the Lymphs Gate on the Gate Navigator
现在,仅仅通过在Gate Navigator(门导航器)上对门进行拖放操作,Lymphs(淋巴细胞)门已经被应用到了二维绘图CD3-FITC.002 (FL1-H vs. SSC-H)上。更新过的二维绘图带有绿色边框;更新过的Gate Navigator(门导航器)绘图列表如图T13.14中的光标和缩略图所示。
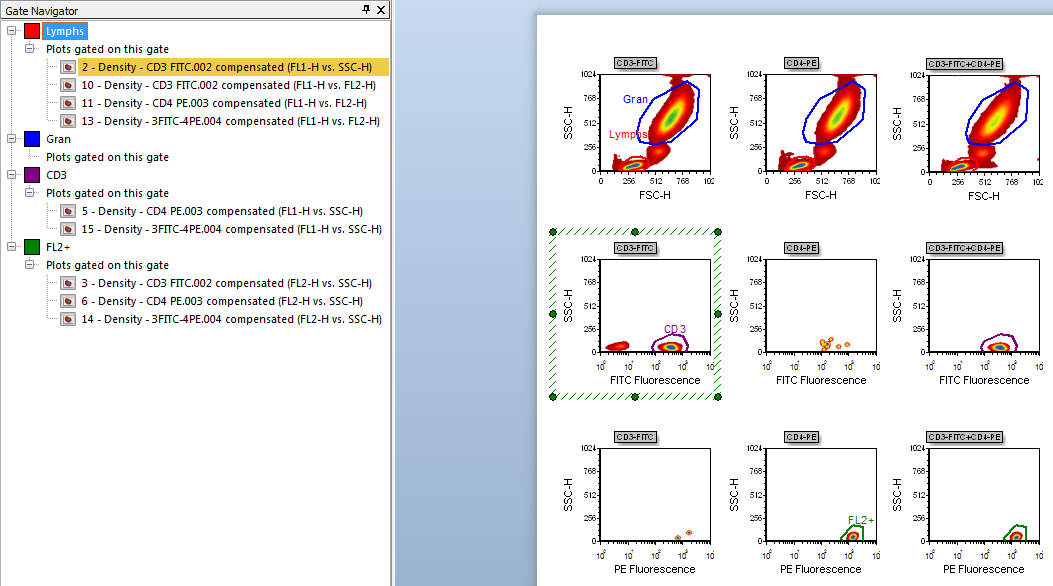
Figure T13.14 Updated Gate Navigator and Layout Reflect the Application of the Lymphs Gate
除了在绘图上拖放Lymphs(淋巴细胞)门外,我们也可以使用相应的弹出菜单。
我们现在将使用Gate Navigator(门导航器),来把绘图移到版面中的一个新页面上。首先,我们要在版面中插入一个新页面。
| 21. | 请点击位于版面底部的插入新页面图标,如图T13.15中的光标所示。 |
Figure T13.15 Insert New Page
或者,用户可以用Insert(插入)命令,来插入一个新的版面。
| • | 请选择Insert(插入)→General(一般属性)→New Page(新建页)命令,如图T13.16中的光标所示。 |
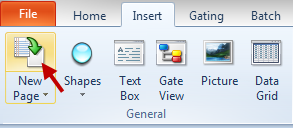
Figure T13.16 Selecting the Insert New Page Command
这时在版面中会出现一个新的空白页面。
| 22. | 请把光标放在Data Navigator(数据导航器)中Lymphs(淋巴细胞)门下的二维密度图CD3FITC.002 (FL1-H vs. FL2-H)上,如图T13.17中的蓝色高亮所示。 |
| 23. | 按下鼠标左键不放。 |
| 24. | 继续按住鼠标,把绘图从Gate Navigator(版面导航器)上拖到版面中的第2页上。 |
| 25. | 当绘图在第2页上时(如图T13.17所示),请松开鼠标。 |
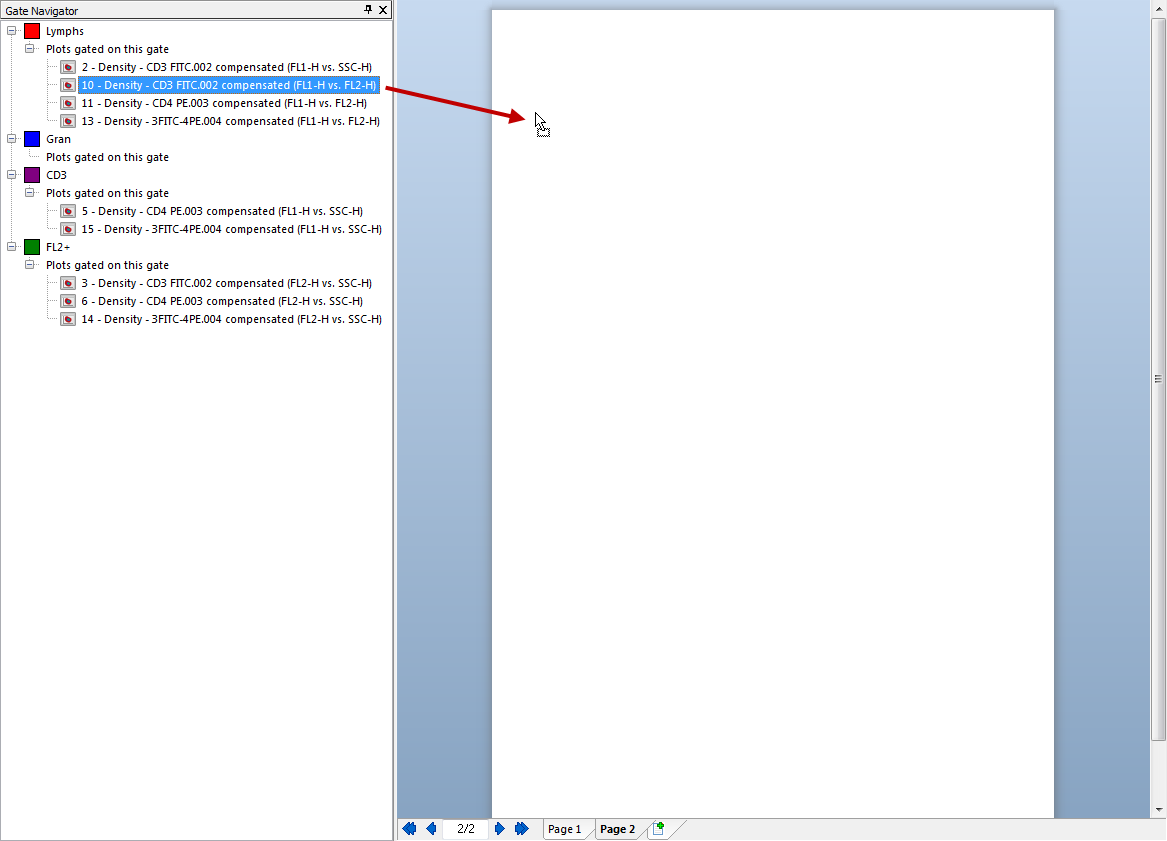
Figure T13.17 Dragging and Dropping a 2D Density Plot Listing onto Page 2 of the Layout
一个新的密度图,18 - CD3FITC.002 compensated (FL1-H vs.FL2-H), 将出现在Lymphs(淋巴细胞)门下方,并出现在版面的新页面中,如图T13.18所示。
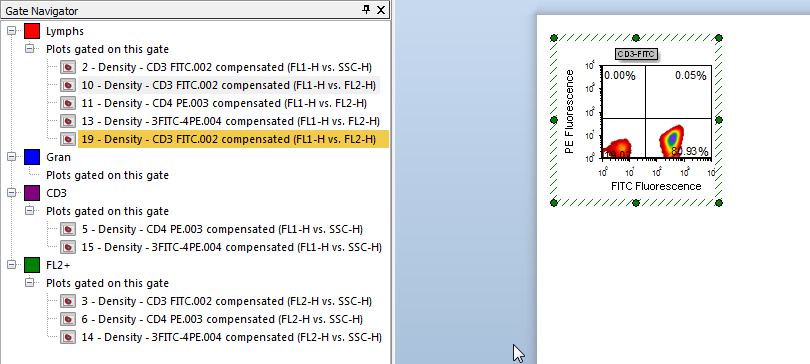
Figure T13.18 2D Plot on Page 2 of the Layout
