在本节教程中,我们将在条形图和散步图上添加额外的数据集作为叠加图层。请完成本教程的前部分(显示额外的数据集)后,在进行后续操作。
| 1. | 点击自定义数据网格的边框,将其选中,它将显示为红色。 |
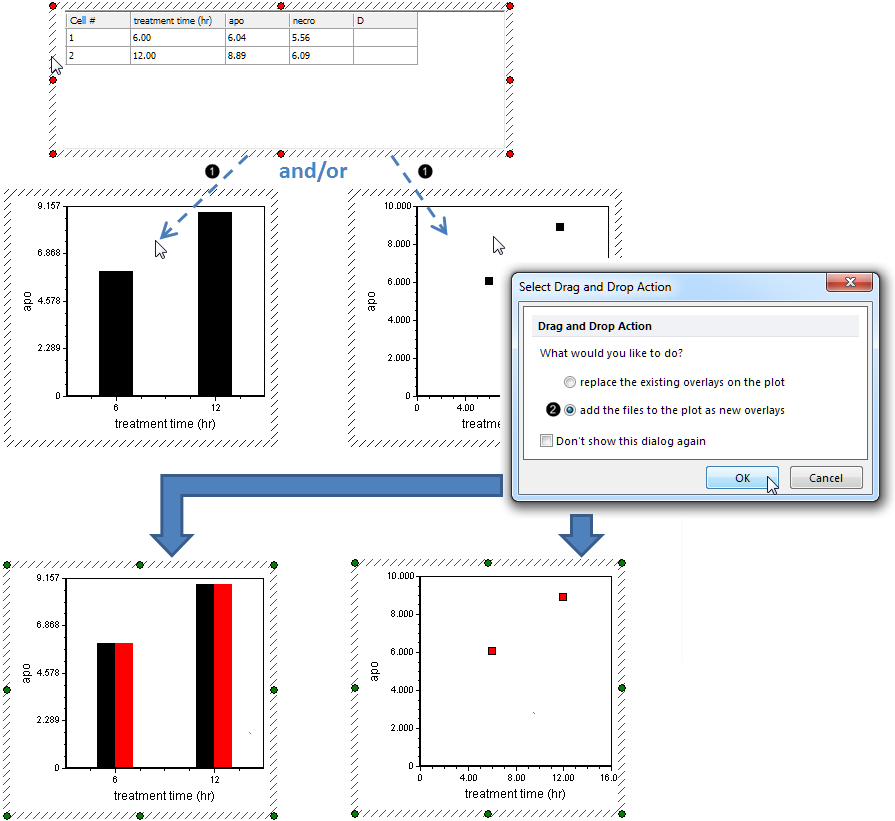
| 2. | 拖拽自定义数据网格中的数据到条形图或者散步图上(图48 )。 )。 |

Figure 48. Dragging and dropping a Custom Data Grid onto a Bar or Scatter Plot to create an overlay
| 3. | 点击add the files to the plot as new overlays(把文件作为新的叠加图层添加到绘图中)单选按钮(图48 )。 )。 |
此时,条形图或散布图将出现,如图48所示。
默认的新的数据层,来自自定义数据网格第二列("apo")的值。现在,我们将重新格式化绘图,来从第三列"necro"得到数据。
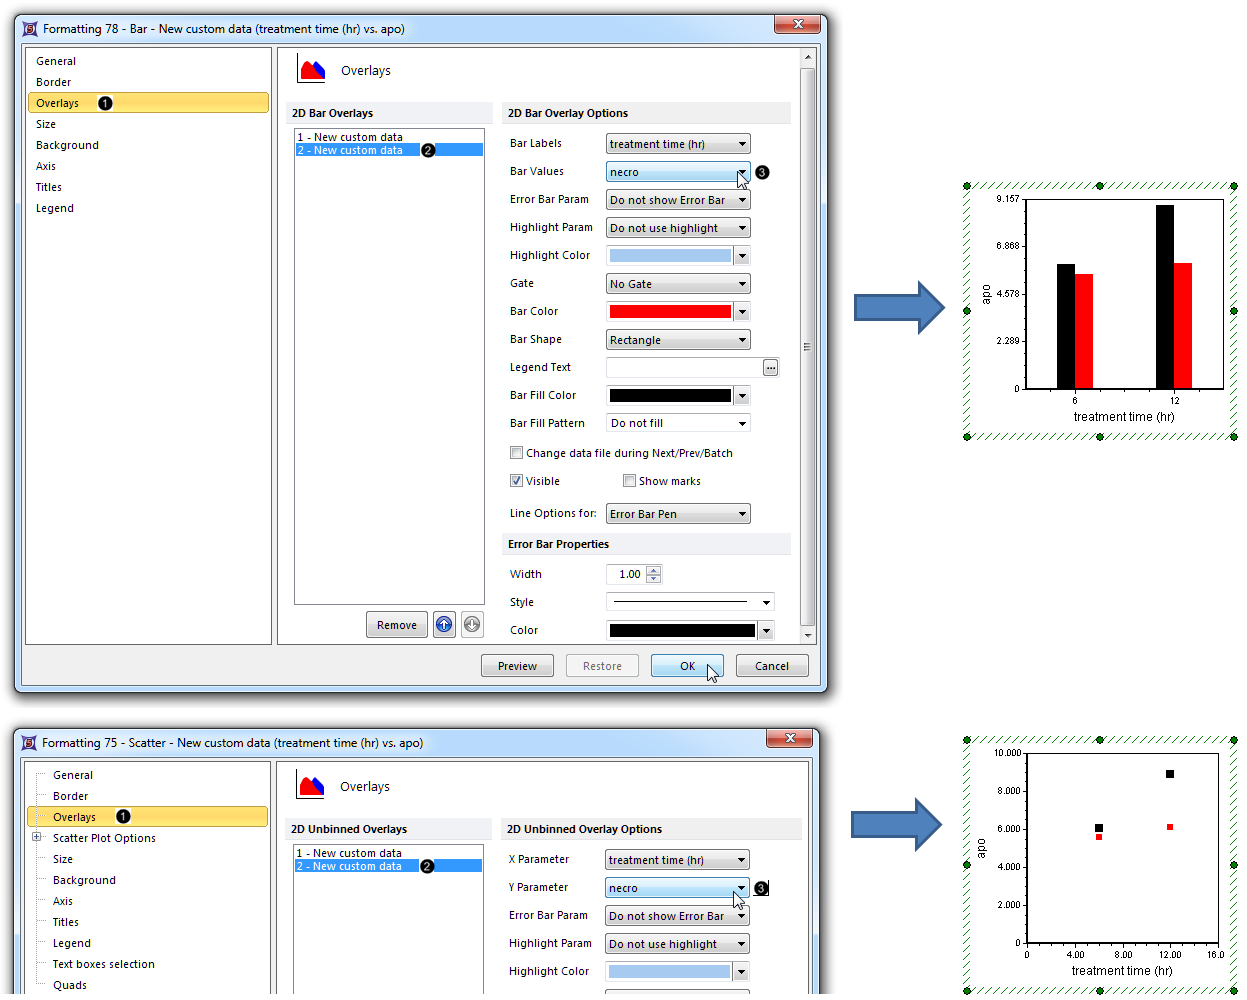
| 5. | 双击条形图或散布图,打开Formatting Bar(格式化条形图)或者Formatting Scatter(格式化散布图)对话框(图49,上面板或者下面板)。 |
| 6. | 点击Overlays(数据层)项目类别(图49 )。 )。 |

Figure 49. Designating the Custom Data Grid column from which the new overlay will be derived
| 7. | 点击2D Bar Overlays(二维条形图叠加图层)或者2D Unbinned Overlays(二维未分组数据层)列表中的2- New custom data(2-新用户数据)(图49 )。 )。 |
| 8. | 从Formatting Bar(格式化条形图)或者Formatting Scatter(格式化散布图)对话框中的Bar Values(数据条值)或者Y Parameter(Y参数)下拉列表中,选择"necro" ,如图49所示 。 。 |
| 9. | 点击OK(图49,鼠标指针处)。此时,条形图或散布图将出现,如图49所示。 |
注意:条形图数据条和散布图数据点的颜色、样式、大小和其他属性,可以单独根据每个数据层,进行自定义设置。请参见本手册的下面章节进行详细了解:
| • | 点击Data(数据)标签→Change Data on All(更改所有数据)→ Next/Previous(下一项/前一项)按钮,来在Data List(数据列表)中进入下一个文件或者上一个文件,同时查看条形图、散布图和饼状图中新数据的更新。 |
| • | 调整绘图上的门,查看条形图、散布图和饼状图的实时更新。 |


