通过拖放操作填充饼状图
在FCS Express 5中,可通过拖放操作来轻松填充饼状图。您可以拖拽绘图或者门、统计标记或者自由文本来创建饼状图,或者取代已插入到版面中的饼状图的部分扇形区域。
当通过拖拽的方法填充饼状图时,下面这些操作都可用:
请查看下面的图片和步骤,来学习如何通过拖拽的方式填充饼状图。
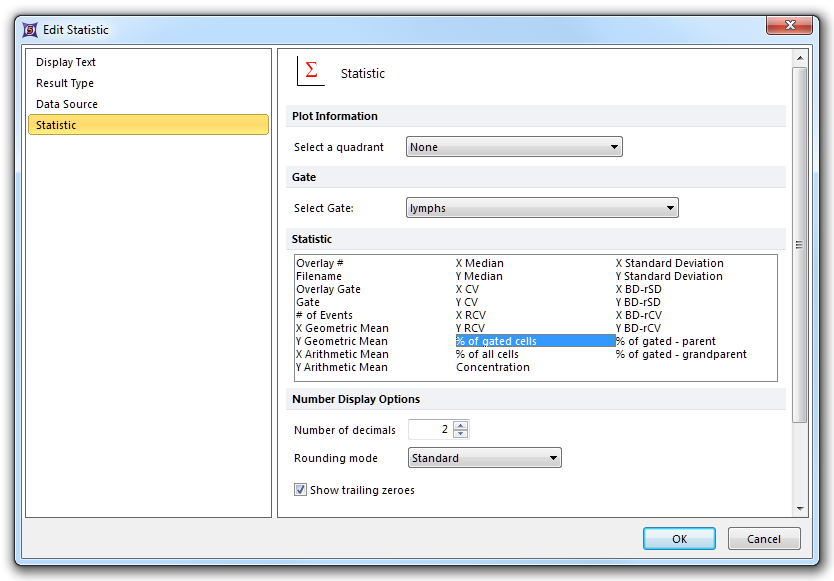
当插入一个饼状图后,将门拖拽到饼状图上将调出Edit Statistic(编辑统计)对话框。可选择特定的统计来绘制门数据(例如,图11所示的“% of Gated Cells(门中细胞百分比)”16)。

Figure 11.15 Edit Statistic dialog appearing after dragging a gate to a Pie Chart
拖放一个门到饼状图上,然后从Edit Statistic(编辑统计)对话框中选择您想要显示的统计项目,如图1117所示。

Figure 11.16 Dragging a gate to a Pie Chart to add a sector (slice)
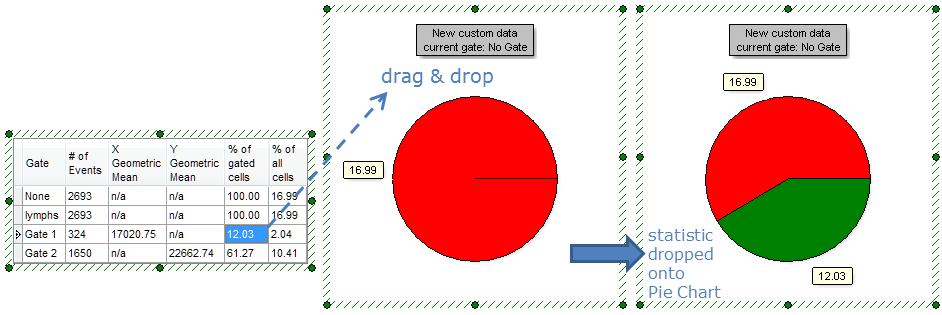
版面上默认的统计窗口和文本框中的统计标记或自由文本,可直接拖拽到饼状图上。必须将数据值放在已绘图上存在的饼形区域外边(如果放在饼形区域上,那拖拽的数据值就会取代饼形区域上已存在的数据值)。在本例中,Edit Statistic(编辑统计)对话框没出现。在下面的例子中,选中的"Gate 1, % of gated cells(门中细胞百分比)"统计被拖拽到饼状图上的空白位置,从而在饼状图上添加了一个新的扇形区域(图1118)。

Figure 11.17 Dragging and dropping a statistic token to the Pie Chart
下面展示了拖拽一个绘图、门或者统计,到一已存在的扇形区域上,从而用想要显示的统计项目将其取代(图1119)。

Figure 11.18 Dragging and dropping a gate to replace an existing sector (slice) on a Pie Chart
