把浓度作为标记来显示
在本例中,我们会:
| • | 把浓度作为标记来显示。 |
用户可以使用FCS Express中的标记来在文本框中插入统计数据以便呈现数据结果。要了解详细信息,请参见“使用文本框和标记”教程。如果你还未设置浓度计算,请参照本教程中的前一节。
| 1. | 请在版面中创建一个空白文本框。 |
| 2. | 在文本框中输入“Beads were added to this sample at a final concentration of 50,000 beads per mL.The final concentration of Monocytes in the sample is <blank space>.(样本中加入的微珠浓度是50,000个微珠/mL。样本中单核细胞的浓度是<blank space>。)”文本。 |
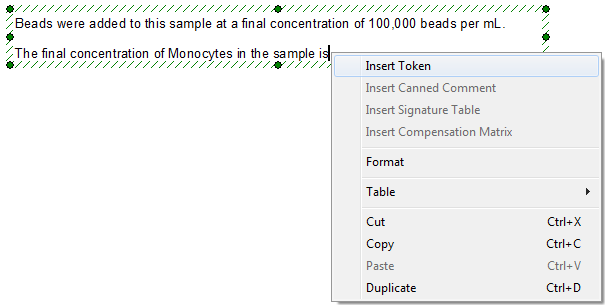
| 3. | 请在文本框中的空白区域右键点击,调出弹出菜单(图T22.13)。 |
| 4. | 请从弹出菜单选择Insert Token(插入标记)(图T22.13)。 |

Figure T22.13 Inserting a Token in a Text Box
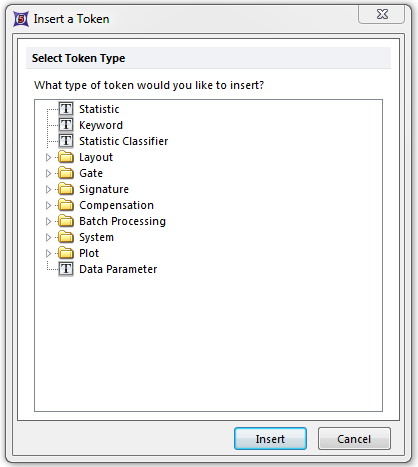
此时,Insert a Token(插入一个标记)对话框将出现(图T22.14)。
| 5. | 请从Insert a Token(插入一个标记)对话框中选择Statistic(统计)。 |
| 6. | 点击Insert(插入)(图T22.14)。 |

Figure T22.14 Insert a Token Dialog
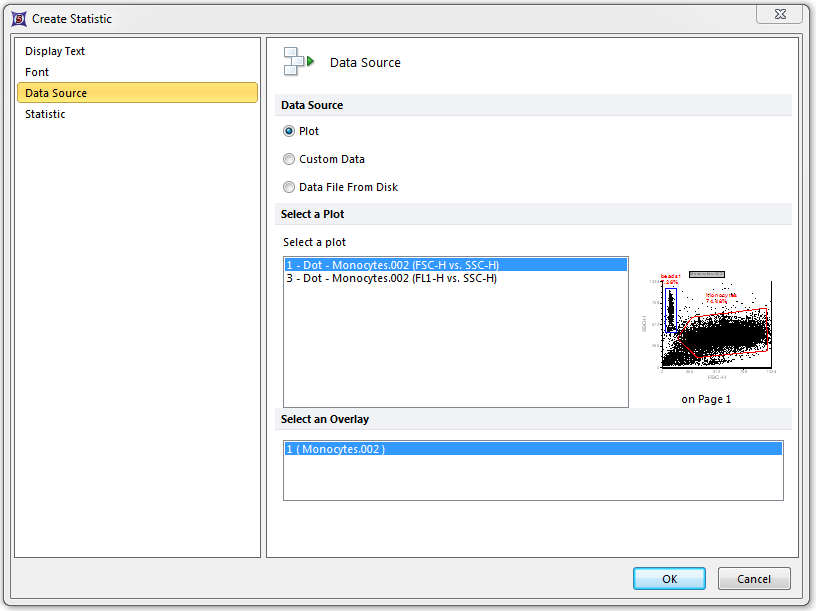
此时,Create Statistic(创建统计)对话框会出现,并显示了Data Source(数据源)类别选项(图T22.15)。在这里,用户将设置标记反映的是哪一个绘图,也就是说哪个绘图的数据将被用来进行浓度计算。如果绘图上有多个叠加图层,用户也将可以指定在计算中使用哪个叠加图层的数据。因为我们已经在教程中创建了一个简单的版面,在这个对话框上我们没有需要修改的地方。

Figure T22.15 Create Statistic Dialog -- Data Source
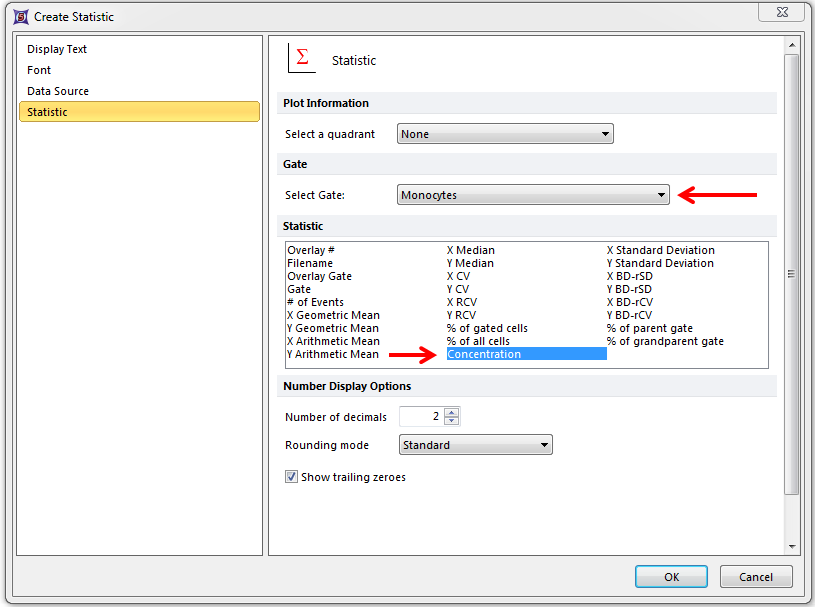
| 7. | 点击面板左边的Statistic(统计)项目类别(图T22.16)。 |
| 8. | 从Gate(门)下拉列表中选择Monocytes(单核细胞)门。 |
| 9. | 请从Statistic(统计)列表中选择Concentration(浓度)。 |
| 10. | 点击OK(图T22.16)。 |

Figure T22.16 Selecting Concentration as the Statistic Token
这时文本框会进行更新,显示我们通过标记定义的单核细胞浓度,如图T22.17中的灰色高亮所示。
Figure T22.17 Text Box with the Concentration Token Value
用户现在可以看到标记中的数目和statistic window(统计窗口)中"Monocytes(单核细胞)"门中的数目是一样的。我们刚刚做的是在两个地方指定了在计算细胞浓度时要用到的四个参数:体积是由Concentration Calculator(浓度计算器)中的Stats Window Setup(统计窗口设置)决定的;细胞的数目是由标记设置自身决定的。
