可以在Bar Plots(条形图)和Scatter Plots(散布图)中添加误差线和高亮显示。本例中,显示了如何在条形图中添加特性。
在布局中已经存在一个电子数据表及与其相关的不带误差线或高亮显示的条形图。此条形图以“apo”的方式和“necro”%-门数据统计形式对三种Color Dot Plots(彩色点图)进行绘制。通过使用array formulae(数组公式)在表格中完成,当点击“dataset 1”列中的任何一个都可以显示出来(图1).

Figure 1. Array formula for calculating the mean of three tokens in a Spreadsheet
用户还可使用array formulae(数组公式)来计算误差线;但是,误差线可能来源于默认的统计标识或者自由文本。
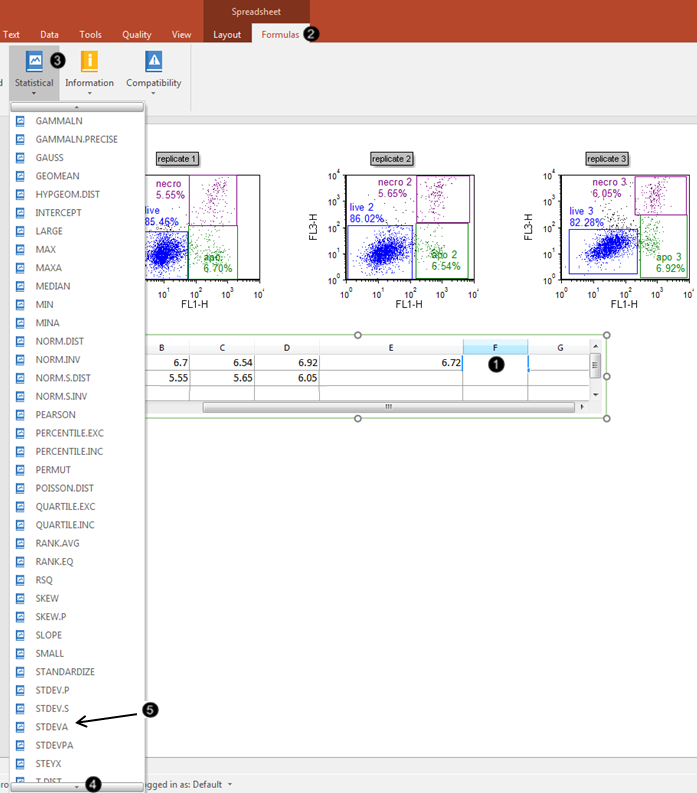
| 3. | 点击表格中的F1单元格(图片2, )将其选中。 )将其选中。 |
| 4. | 点击公式标签,该标签之前隐藏在电子数据表标签组下。2, ). ). |

Figure 2. Inserting a function into the Spreadsheet cell
| 5. | 点击statistical(统计数据)命令(图2, ). ). |
| 6. | 向下滚动统计学公式菜单(图片.2, 直到看到“STDEVA” 直到看到“STDEVA” |
| 7. | 从菜单中 选择“STDEVA”(图2, ). ). |
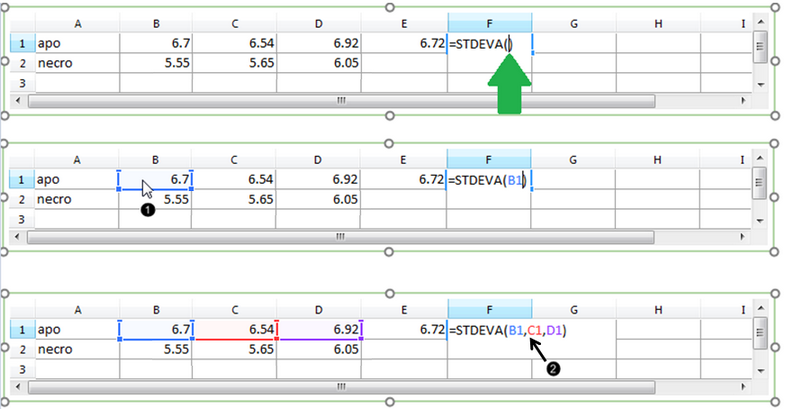
然后输入单元格B1-D1作为StdDev(标准偏差)array formulae(数组公式)的组成部分
| 8. | 点击表格中的B1单元格(图片2, 2,光标在“STDEVA”公式括号内时会显示为绿色箭头. 2,光标在“STDEVA”公式括号内时会显示为绿色箭头. |
| 9. | 输入一个逗号(”)(图片2, ). ). |
| 10. | 单元格C1-D1重复步骤8和9。完成后,填满的公式就像图片3,所示。. |

Figure 3. Entering components of the Standard Deviation formula
针对误差线,自定义数据网格"apo" 行就包含一个完整的StdDev(标准偏差)数组公式,且该误差线已用单元格F1结果进行评估(图4).

Figure 4. Numerical result of completed array formula within the Spreadsheet
我们在自定义数据网络的“necro”行输入相应的平均值和误差线,拖拽适合的单元格填充各个系列
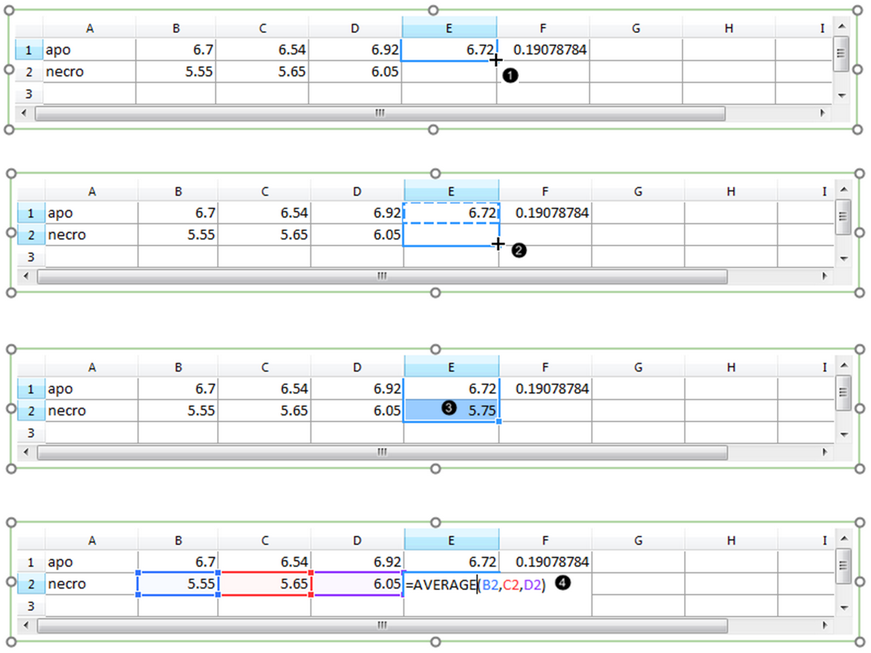
| 11. | 点击表格中的单元格E1,在开始教程前为您在版面中创建了完整的AVERAGE格式。 |
| 12. | 移动鼠标指针到单元格E1的右下角,直到光标变成十字形状(图5, ). ). |

Figure 5. Filling a series in the Spreadsheet.
| 13. | 拖拽鼠标到单元格E2的右下角(图片2, ). ). |
| 14. | Release the mouse button (Fig.2, ).单元格E2中的数值作为填充整个系列的结果 ).单元格E2中的数值作为填充整个系列的结果 |
| 15. | 双击单元格E2可以看到公式及其组成(图片5, ).注意,该公式真实的扩展,但是指的是电子表格中第2行的“necro”%-gated值。 ).注意,该公式真实的扩展,但是指的是电子表格中第2行的“necro”%-gated值。 |
| 16. | 对单元格F1重复步骤11-15,填写“necro”%-gated值的标准偏差公式。电子表格将如下面的图6所示 |

Figure 6. The Standard Deviation for the "necro" row values has been calculated by filling the appropriate cell in the Spreadsheet.
我们现在将格式化条形图,以从电子表格中的相应列中导出误差条
| 17. | 双击条形图,打开Formatting (格式)对话框。 |
| 18. | 点击Overlays(数据层)项(图2, ). ). |

Figure 7. Adding error bars to a Bar Plot in the Formatting dialog
| 19. | 选择“F”,它指的是电子表格的列F,从2D Bar Overlay Options(二维条形图数据层选项)→Error Bar Param(误差线参数)下拉列表中选择(图2, ). ). |
| 20. | 选择红色从颜色下拉列表中Error Bar Properties(误差线属性)的部分(图2, ). ). |
| 21. | 点击OK(Fig.2, ). ). |
此时,条形图就将出现如右图2,所示
| • | 点击Data(数据)标签→Change Data on All(修改所有数据)→ Next/Previous(下一项/前一项)通过设置Data List(数据列表)中的文件及观看新数据的更新如条形图和散步图来向前发展。 |
在我们将增加针对条形图、散步图和饼状图的高亮和爆炸参数的功能介绍。


