在之前的章节,我们已经插入了增殖绘图,最优化增殖拟合,格式化增殖绘图和插入增殖拟合及群体统计。我们现在将这些操作联合起来,用以创建一个最终的展示和excel报表。
我们将使用中合并了所有上述部分的Proliferation Tutorial for Batch Processing.fey layout版面,有了这些铺垫,我们可专注于批处理过程。
| 1. | 请打开“Proliferation Tutorial for Batch Process.fey”版面。 |
| 2. | 点击Batch(批量) 标签→Batch(批量) Processing(批处理)→Batch Actions(批操作)命令 |
此Batch Actions(批操作)窗口将打开。
| 3. | 点击Add Action(添加操作)在点击操作选项中。 |
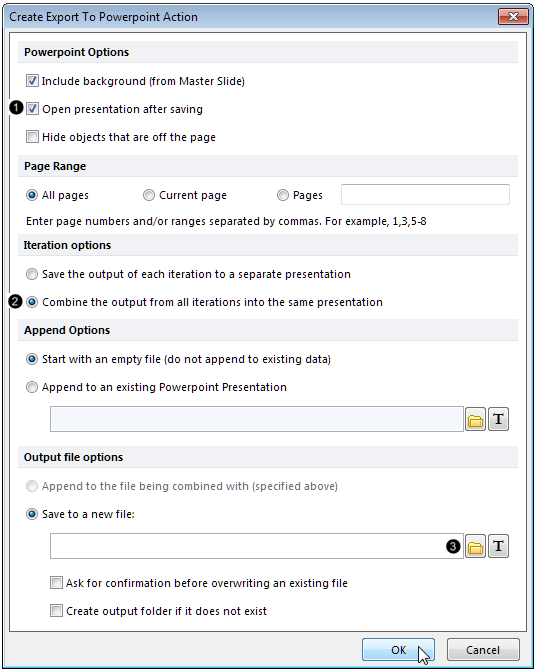
此Create Export To Powerpoint Action Dialog (创建导出到Powerpoint操作对话框)将打开(图T20.15)。
| 4. | 选中Open presentation after saving box(保存后打开演示文稿) (图T20.15)。 (图T20.15)。 |
| 5. | 选中Combine the output from all iterations in to the same presentation(把所有循环输出的结果合并到一个演示文稿中)单选按钮 (图T20.15)。 (图T20.15)。 |
| 6. | 点击Output file options category(输出文件选项)→Save to a new file(保存到新文件) (图T20.15)。 (图T20.15)。 |

Figure T20.15 Editing the Create Export To Powerpoint Action options.
| 7. | 请为将要创建的Powerpoint文件夹选择一个保存位置和文件名。 |
| 10. | 点击Add Report(添加报表)在添加报告选项中。 |
此Excel (Column Mode) Options(Excel (列模式)选项)窗口将打开。
| 11. | 点击Output file options category(输出文件选项)→Save to a new file(保存到新文件). |
| 12. | 请为将要创建的Powerpoint文件夹选择一个保存位置和文件名。 |
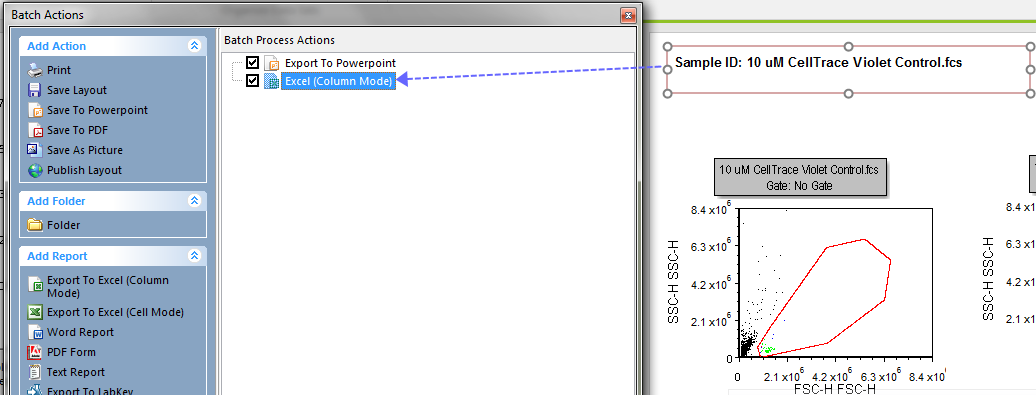
| 15. | 拖动包含样本编号的文本框从门页面顶部到Batch Process Actions(批处理操作)中Excel (列模式)图标的顶部窗口(图T20.16)。 |

Figure T20.16 Dragging and dropping the sample ID text box to the Excel (Column Mode) batch action.
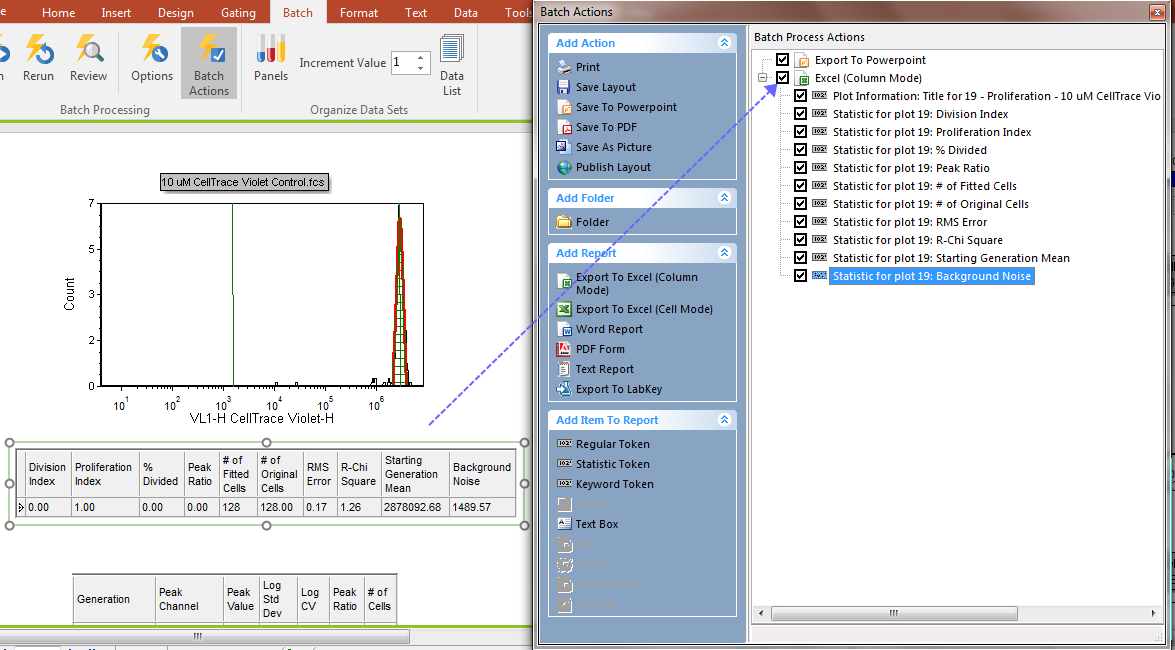
| 16. | 选中所有在Proliferation Fit Statistics Table(增殖拟合统计表)中的统计,它们将以蓝色高亮显示(图T20.17)。 |
| 17. | 将选中的选项拖拽到批操作处理中的Excel (列模式)图标的顶部窗口(图T20.17)。 |

Figure T20.17 Dragging and dropping the Proliferation Fit Statistics table to the Excel (Column Mode) batch action.
拖拽样本编号文本框和表格数据到Batch Process Actions(批处理操作)窗口→Excel (列模式)图标处,这时样本编号和所有的统计数据就从表格中添加到excel报表中了。
| 18. | 点击Batch(批量)标签→Batch Processing(批处理)→Run(运行)按钮,来开始批处理操作。 |
此批处理操作将运行数据列表中的4个样本,并生成包括8张幻灯片的Powerpoint文件(每个样本有2张幻灯片)和含有4行的Excel文档(每个数据占1行)。


