R Cluster Transformations
自定义聚类分析可以通过使用R Cluster Transformations的方法输入到感兴趣的文件中。
为了兼容这种方法,执行函数通过包含如下插槽的S4目标来定义R的脚本:
| 1. | clusterAssignments:整数向量的集群作业; |
| 2. | numberOfClusters:整数数量的新集群; |
| 3. | clusterNames:特征向量包含新集群的名称。 |
通用的R脚本兼容R Cluster Transformations输入方法如下所示:
Execute <- function(mat)
{
setClass("ClusteringResult",
representation(
clusterAssignments="integer",
numberOfClusters="integer",
clusterNames="character"
),
prototype(
clusterAssignments=c(),
numberOfClusters=integer(0),
clusterNames:
)
)
result <- new("ClusteringResult")
result@numberOfClusters <- as.integer(A)
result@clusterAssignments <- as.integer(B)
result@clusterNames <-C
return(result)
}
这里的A,B和C的值由用户自己定义。如上所述:
| • | A可以是任意整数。注意:as.integer()的功能要求数字保存为传统的数值类型; |
| • | B可以是用户定义的任意一个聚集。它必须是代表长度的一个整数向量,数值上要等于mat矩阵的事件数量。独特整数值的数量必须等于A。群集的开始数值必须是0. |
| • | C是一个特征向量包含新集群的名称。多个名称的可以特异性通过c()的功能[如c(“名字1”、“名字2”、“名字3”、))。长度需要等于A。 |
如上所述,R脚本结构可以通过R Cluster Transformations集成到FCS Express中,方法请按照后面的步骤:
| 1. | 打开转换(transformation)窗口,选择Tools(工具)标签→Transformations→Transformations命令。 |
| 2. | 点击下拉箭头相邻的蓝色+ |
| 3. | 选择R Cluster Transformations。Transformation窗口将会显示为下图所示图29.46: |
| 4. | 点击Template File右侧的省略号浏览*.FCS模板文件(下图-第1步)。Transformation窗口将填充上选中的含参数信息的*.FCS文件。 |
| 5. | 选择包含参数的mat矩阵(下图所示-第2步)。 |
| 6. | 根据需求,通过选择或改变Parameter Scaling Options(参数缩放选项)来适当调整选中的参数(下图所示-第3步)。 |
| 7. | (可选操作)选择一个门,从Gate(门)下拉菜单中选中门内仅包含事件的mat矩阵(下图所示-第4步)。 |
| 8. | 请选择Event Order(事件命令)这个选项用来定义mat矩阵的方向。如果选择Events as Row,那么mat的事件显示在行中,而参数显示在列中。如果选择Events as Columns,那么mat的事件显示在列中,而参数显示在行中(下图所示-第6步)。 |
| 9. | 设置群集的输出参数(下图所示-第5步)。下面是可用群集输出报告的生成方式。 |
| o | Cluster Assignment:群集成员的内部标签指代的是每个事件。这个内部标签可以用FCS Express的群集的热图形式来展现,也可以通过Data grid进入。 |
| o | Distance to Cluster Centroid:用来定义群集中事件到群集中心的距离。具体数值用特殊的柱状图进行标注。 |
| o | Distance to centroid Histograms:定义和Distance to Cluster Centroid一样,但是每一个群集的数值是分组显示和单独标注的,群集的计数从1到群集的数量。 |
| o | Gaussian CV SSE Scaled:这里代表的是每个事件都是基于群集成员被标注的,因此群集的的出现是独立于柱状图的。给到群集成员的整数值从0群集1的数目,人为的干预被导入到数据中。Gaussian SSE scaled指代的是每个群集Gaussian(正态分布)的标准差与群集误差平方值总和的比值。 |
| o | Gaussian CV Unscaled:这里代表的是每个事件都是基于群集成员被标注的,因此群集的的出现是独立于柱状图的。给到群集成员的整数值从0群集1的数目,人为的干预被导入到数据中。Gaussian CV unscaled指代的是每个群集Gaussian(正态分布)的标准差与群集误差平方值总和的比值 |
| o | Gaussian Y Data:事件Gaussian(正态分布)的标注方法如下: |
| 10. | 点击R Script File右侧的省略号浏览R方程文件(下图所示-第7步)。 |
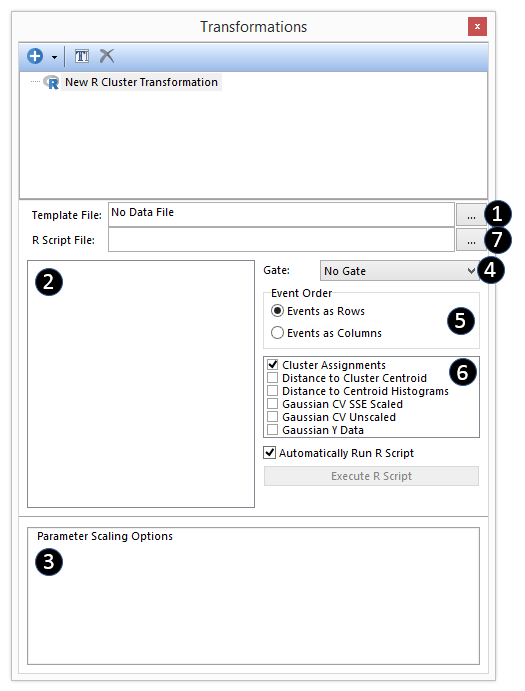
Figure 29.52. The transformation windows populated with a New R Cluster Transformation.
上述步骤的结果如下图所示(图29.47):
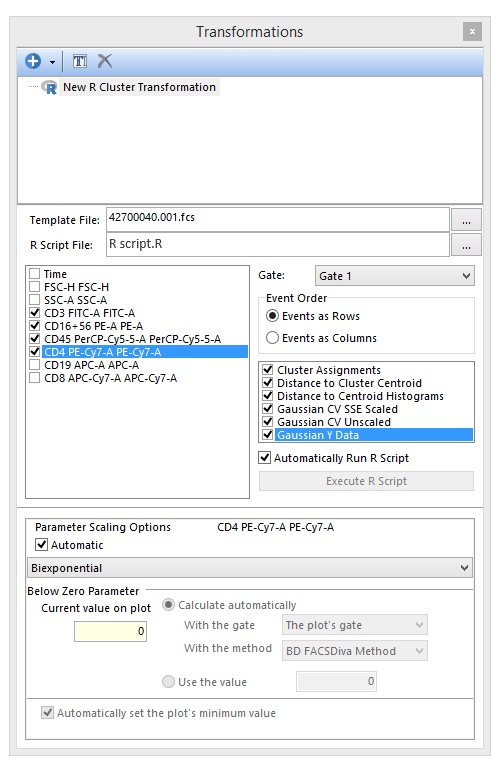
Figure 29.53. The transformation window with a fully set New R Cluster Transformation.
自定义的R Cluster Transformations转换形式就可以应用于点图。
R Script在自动运行时就会被应用于热图(Heat Map)或者一个数据中,或者作为一个选在转换对话框中进行修改。如果要推迟运行R Script,就取消自动运行R Script。这样做后,将对您展示Execute R Script(图29.48)的选项,可以按照需求进行计算。
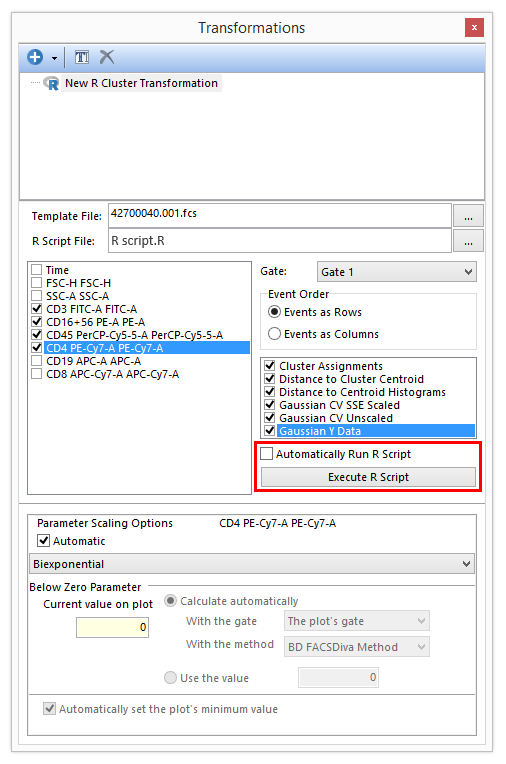
Figure 29.54 Unchecking the Automatically Run R Script box will allow the user to run the R script manually only when required.
一旦一个R Cluster Transformations转换文件被创建,结果可以通过Heat Maps(热图)和Data Grids(数据网格)进行存取。R转换形式必须被应用于绘图中。
R转换形式可以通过下面的方法应用于Heat Maps(热图)和Data Grids(数据网格):
拖拽(图29.49)
| 1. | 左键点中New R Cluster Transformation在从Transformation(转换)窗口中。 |
| 2. | 将transformation拖拽到想要的目标中(Heat Maps或Data Grids)。 |
| 3. | 放开鼠标键。 |
此时,R转换形式就被应用于目标中了。如果目标是一个Heat Map绘图,绘图的标题就会包含“R Cluster Transformations”,从而说明转换形式已经被应用到文件中。
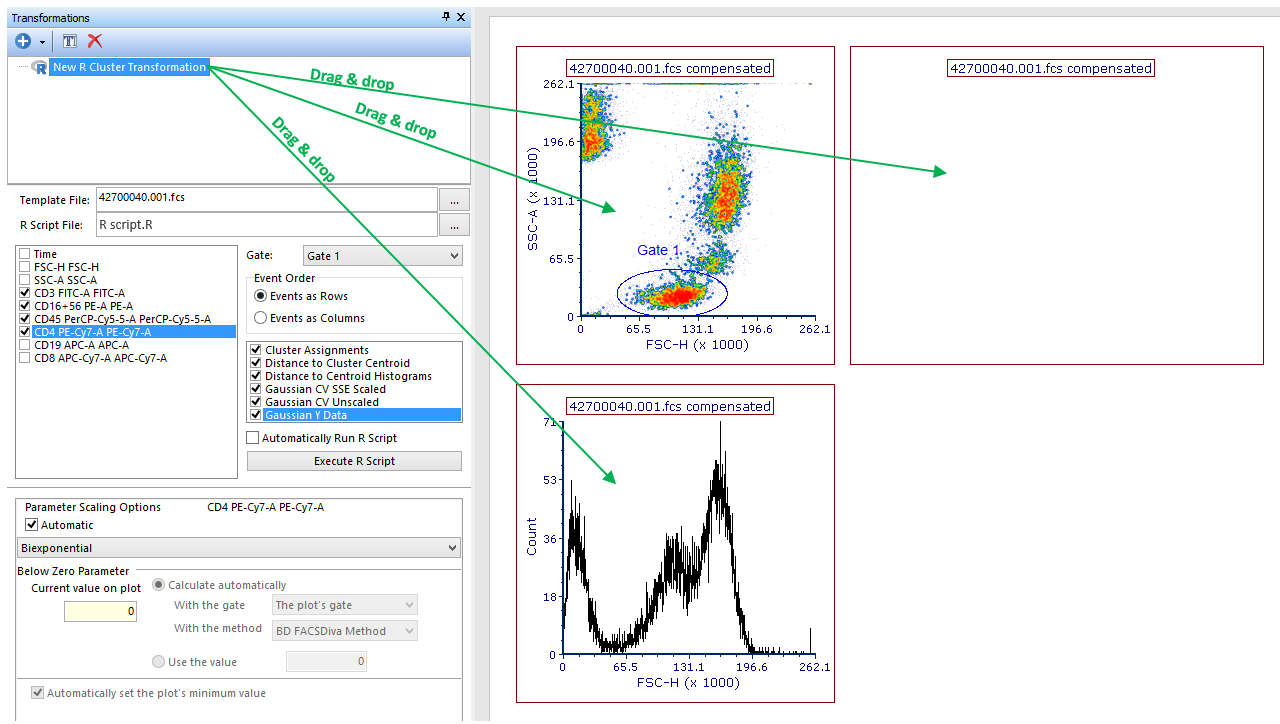
Figure 29.55. Applying an R Cluster Transformation to a plot by dragging the transformation from the Transformation navigator to the plot (green arrow).
通过Formatting Dialog(格式对话框)(图29.50)
| 1. | 进入Formatting→Overlays Dialog (对一维、二维绘图和热图)或Formatting→General dialog(数据网格)。 |
| 2. | 选择R Cluster Transformations下拉框中的Transformation(转换)选项。 |
| 3. | 点击OK。 |
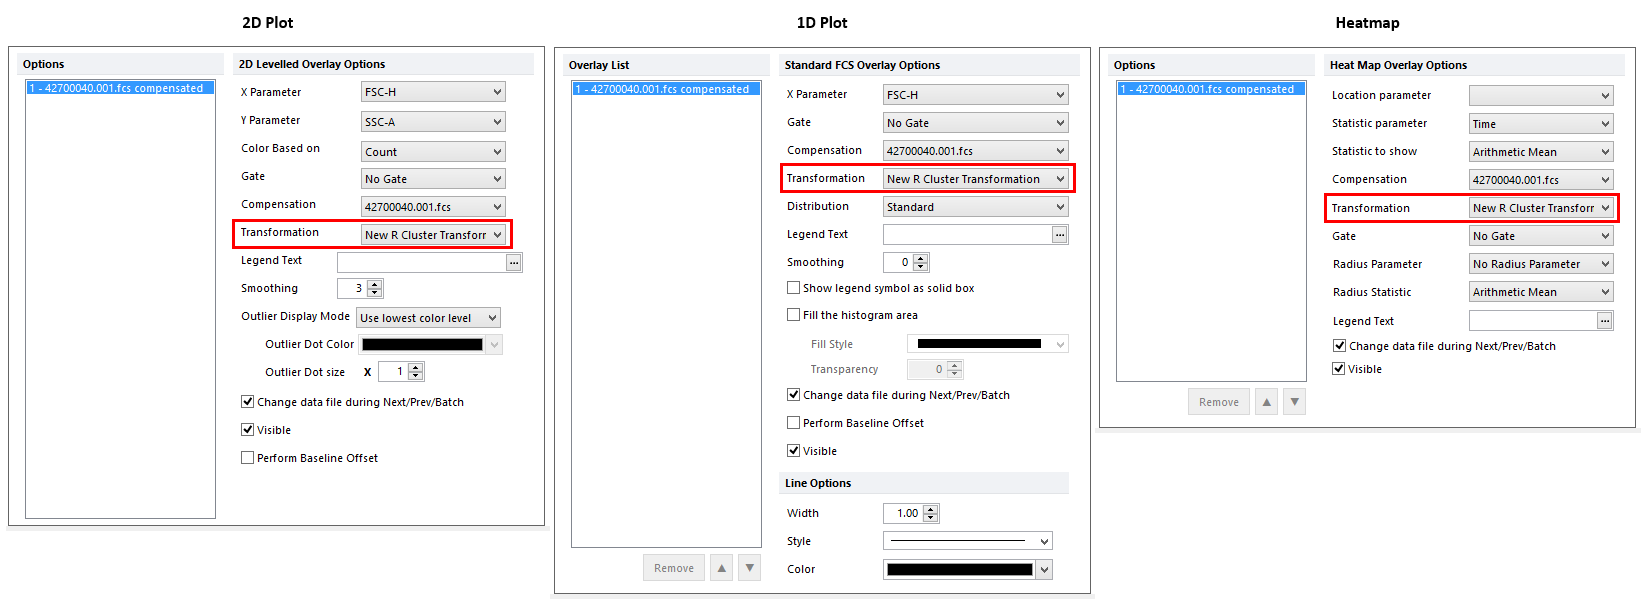
Figure 29.56. Applying an R Cluster Transformation to a plot by selecting the R Cluster transformation from the Transformation dropdown of the Formatting Overlays dialog.
上述方法描述的二维绘图、热图和一维绘图结果会重新呈现如图29.51。当一个R Cluster Transformation被应用于二维绘图、热图和一维绘图后,“R Cluster Transformations”的后缀将出现在该绘图的标题中。

Figure 29.57. The heatmap title contains the "R Cluster Transformation clustered" siffix when an R Cluster Transformation is applied.
二维、一维绘图和热图已经可以在后续分析中用于门的创建、标记和门的优化(请参见Heat Map部分的Working with k-means parameter章节来详细了解如何创建well gates)(图29.52)。

Figure 29.53 Examples of 2D markers ("Cluster 1" on the left), gate ("Cluster 2" on the left), well gate (blue well gate in the Heat map) and marker (M1 gate on the right).
