使用k - means参数
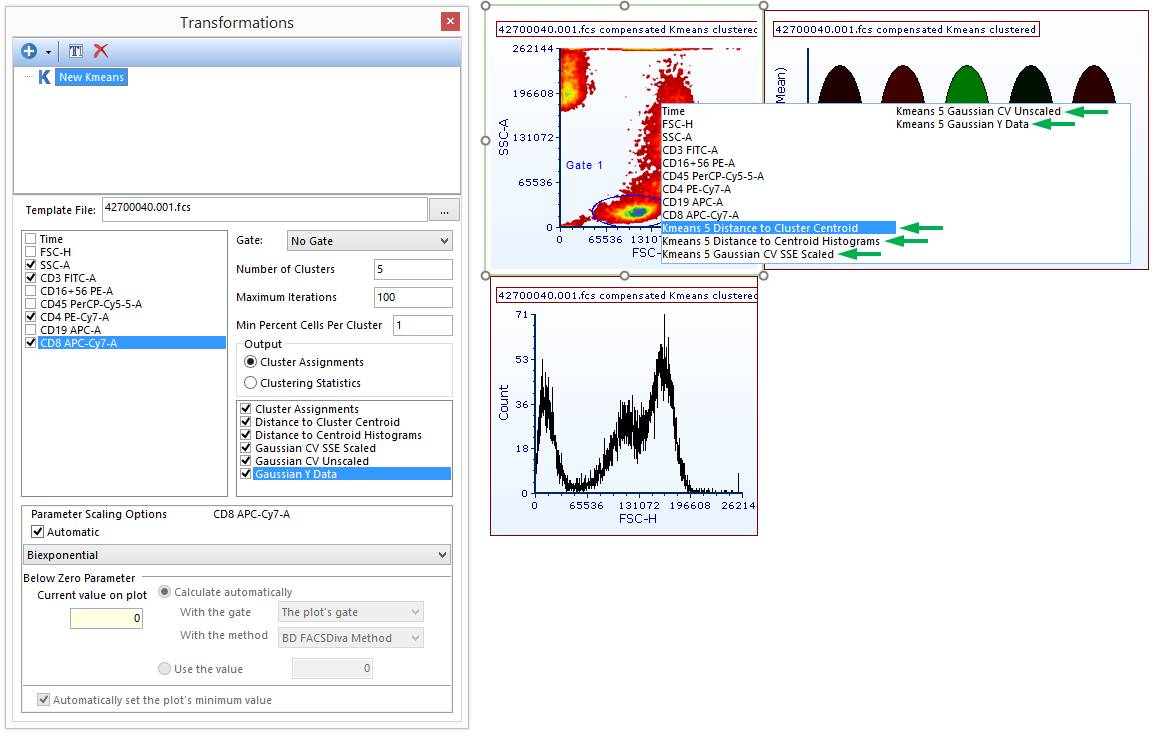
一旦一个K-means转换被用到点图中,新创建的以下集群分配参数中创建可以通过单击图29的坐标轴标签来访问。28请注意:热图仅能显示集群分配参数当k-means转换被应用时,会自动显示集群分配参数。

Figure 29.34 Newly created pareameters can be accessed by clicking on the axis label of the plot of interest.
Gates(门)可以在以下集群分配参数中创建以便在一个或多个集群中选择事件
| • | 集群分配参数(热图), |
| • | 直方图(一维或二维点图), |
| • | Gaussian CV SSE Scaled(一维或二维点图), |
| • | Gaussian CV Unscaled(一维或二维点图), |
这些门可以被用于反圈非集群参数的细胞群。
下面是使用上述参数的集群选择的一些示例
→1D Plots(一维绘图)→
可以在显示集群参数的一维图上创建标记,就像在非集群参数上一样。在把标记转换为门以后可以使用该标记来支持非集群参数的细胞群。(图2929).

Figure 29.35. Markers can be used to select cluster on 1D plot displaying a clustering parameter. Gate 1 was defined on a density plot and events within it have been clustered. Gate 1 has also been then applied to the k-means transformed histogram. Markers from the histogram were converted to gates and back gated onto the CD4 vs CD3 dot plot.
→2D Plots(一维绘图)→
可以在二维图上创建门以展示集群参数,就像可以在二维图上可以创建门以展示非集群参数一样。在下面例子中,可以在二维如上创建门以在X轴和Y轴上显示集群参数,但是集群参数能够同非集群参数一起显示。(图2930).

Figure 29.36. Gates can be used to select clusters on 2D plot displaying one or more clustering parameters.
热图
当一个转换应用到它们的时候,集群分配就会自动显示在热图上。Well Gates(微孔门)能够用来选择一个或多个集群(如:微孔),:再用于后续的分析。在下面的例子中(图2931在集群2和集群3上创建了两个微孔门(微孔门2在热图上被标注为红色)。

Figure 29.37. Well gates can be used to select clusters on heatmaps.
