设置要显示的参数
要选择在Heat Maps(热图)上显示参数和统计,有以下方法:
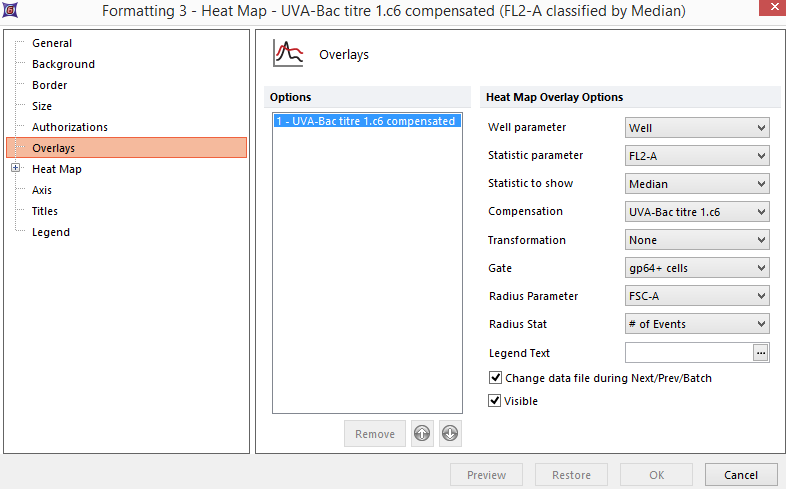
| • | 请选择Heat Maps(热图),然后使用Format(格式化)标签按钮→选择Plot Options(绘图选项)→Overlays(叠加图层)命令(图325然后选择在热图overlay选项下的下拉菜单Heat Map Overlay Options. |

Figure 32.5 - Heat Map Overlays Command from Ribbon
| • | 请右键点击Heat Maps(热图)选择Format(格式化)从弹出菜单的格式,然后选择Overlays(叠加图层)项目类别,再选择热图Overlay选项下方的下拉菜单Classification Overlay Options(分类数据层选项)Heat Map Overlay Options(图326). |
| • | 在y-轴标签上点击鼠标并按住不放,然后选择一可用的参数。可用以上两种方法来设置要显示的统计。 |

Figure 32.6 Heat Map - Setting the Statistic Parameter and Statistic to Show
图中显示的数据是Statistic parameter(统计参数)和Statistic to show(要显示的统计)属性的组合(例如,算术平均值、标准偏差、变差系数、中间数、事件数和第75%百分比等)属性。FCS Express计算从微孔板上所有微孔中获得的统计数值的平均值。然后根据据配色方案属性,每个微孔会显示一个颜色。要为一微孔设定颜色,一般是根据比较每个微孔的统计数值和以下两个值其中的一个:
| • | 整个微孔板的平均值±标准偏差。 |
| • | 一个事先定好的阀值。 |
从Statistic parameter(统计参数)下拉列表Histogram - ChannelCalibation.001 (FL3)。该列表一般包含从用户设备测量或者计算所获取的一系列参数。从相应的下拉列表中的预定义统计数据选择Statistic to show(要显示的统计)Statistic to show(要显示的统计)。
请注意如果一个Statistic(统计) 显示 对于某个孔的值并不能计算,例如,几何平均值是负值,这个值会出现 “空”与垂直和水平的阴影标记,如屏幕截图右侧。选择不同for a well cannot be calculated, for instance, the Geometric Mean of a negative value, the well will appear ? ? ? ? ? ? ? ? ? ? ? ? ? ? ? ? ? ? ? ? ? ? ? ? ? ? "empty" with vertical and horizontal hatch marks as in the screen shot to the right.选择不同的统计显示Statistic to show(要显示的统计)应该会比较合适 |
|
、一个Heat Maps(热图)可像其他FCS Express中绘图那样,有一个Gate(门)set similar to any other plot in FCS Express.例如,可以在一显示数据的点状图上画一个门,然后将其拖拽到热图上。您也可以使用Formatting(格式化窗口)中的下拉列表来对门进行设置。
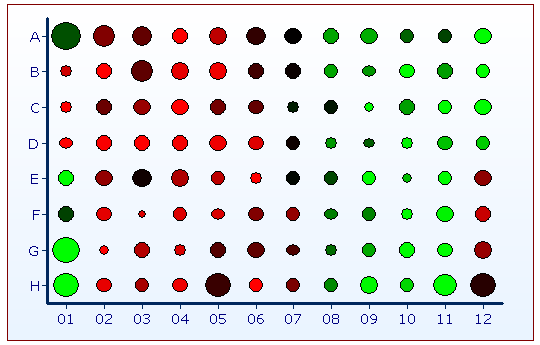
FCS Express允许分配一个参数的统计量来表示门的半径(图327).热图的半径可以根据所选的统计值发生改变从半径参数下拉菜单列表里面选择参数Histogram(直方图) - Channel Calibation.001 (FL3)。然后从统计半径下拉菜单列表选择!Radius StatHistogram - ChannelCalibation.001 (FL3)。

Figure 32.7 - A heat map using the number of events per well as the radius statistic and the mean intensity as the heat statistic. Larger size wells represent wells with more events present in the well.

