Color Levels(颜色层次)
光谱图颜色层次选项仅在颜色密度显示模式下启用。Color on DensityDisplay Modeonly.
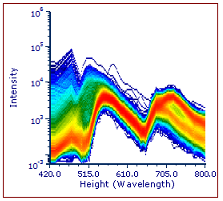
可以用处理2D密度图的颜色等级相同的方式对色谱图的色阶进行格式化2D-Density Plot Color Levels下面是带自定义颜色色阶的图谱例子(图8.89)更多的细节和例子可以也可以参看格式化一个图谱的章节Formatting a Spectrum Plot chapterfor additional details and examples.

Figure 8.89 - The two Spectrum Plots in the center of the picture have customized Color Levels.
