Axis Options
If you commonly work with data files in both the FCS 2.0 and FCS 3.0 standards, you may find that you want to set different default options for each of these file types. For example, fluorescent parameters from FCS 2.0 files will be best viewed in a four-decade log scale, while fluorescent parameters from your FCS 3.0 files might be best viewed in a biexponential scale.
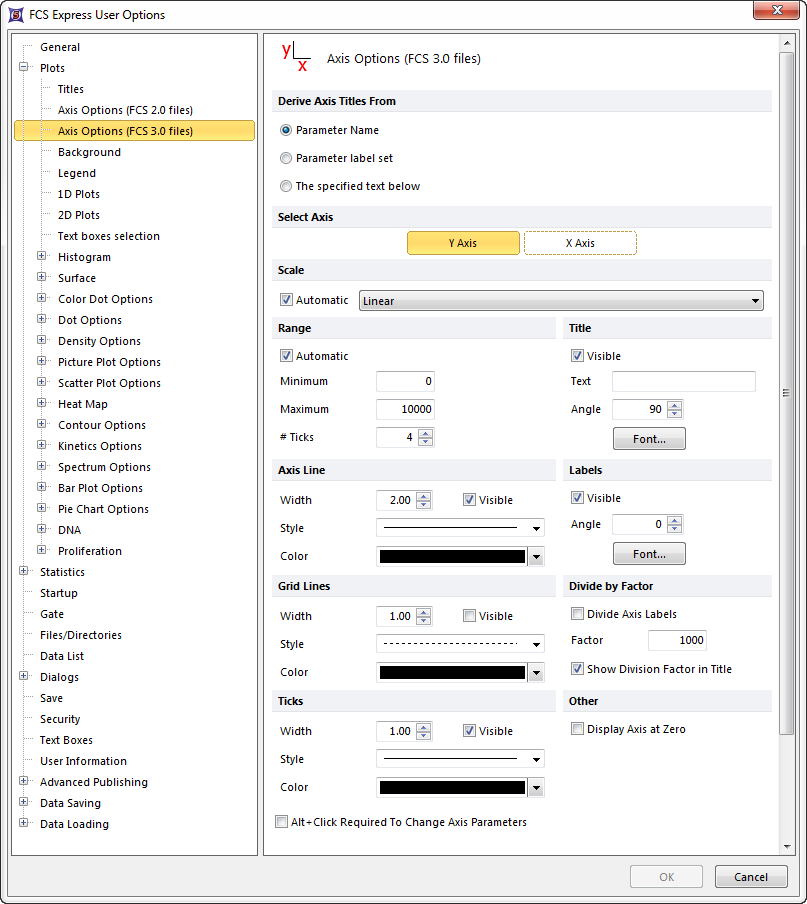
There is a full set of Axis Options for each type of data file (Figure 8.6). Therefore, when you open a new plot on your layout, the default settings for each axis will depend on what type of data file it is.

Figure 8.5 Edit Preferences - Axis Options
By default, clicking on the axis label of a plot will allow you to change the parameter for that axis. While this is convenient for users who are designing layouts, parameters may be accidentally changed on occasion. You can force the Alt key to be required to change parameters by checking the Alt+Click Required To Change Axis Parameters checkbox.
