Plot Options
The Plots FCS Express User Options category lets the user select how plots appear when they are first opened. Almost any option that can be set on a plot can be set as a default value including size, color, font, background, etc.
Alternately, you can either:
| • | right-click on a plot and select Set as Default from the pop-up menu. The plot options selected for that plot will be used as the default options for all plots opened in the future, or |
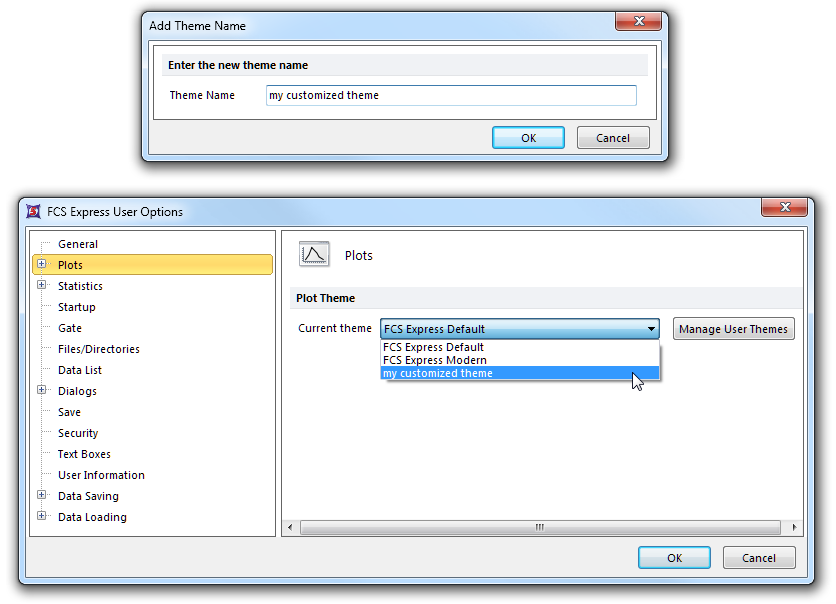
| • | right-click on a plot and select Save as Plot Theme from the pop-up menu, enter a Theme Name in the Add Theme Name dialog box, and click OK (Figure 8.4, top). Those plot options can then be set as the default via Plot Theme Options (Figure 8.5, bottom) and will take effect on subsequently inserted plots. The Manage User Themes button enables renaming and deleting of user-defined Themes. |

Figure 8.4 Plot Theme options
In most cases, the general FCS Express User Options settings mirror the specific plot FCS Express User Options, as described in Formatting Features Shared by All Plots. The option for Fill overlay area is discussed in Overlays (Formatting Single Parameter Histograms). Other discrepancies are described below.
