Changing Histogram Overlays
In the course of this example, we will lear how to change histogram overlays to stacked:
For convenience, we are going to start with the same layout as before. The images contained within this section will continue with the layout from the previous section.
| 1. | Select the histogram (see selecting objects). |
| 2. | Select the Format→Plot Options→Specific Options command (Figure T3.27). |
Alternatively you can Right-click on the histogram and select Format→Histogram→Histogram Specific Options.

Figure T3.27 Format Specific Options Command
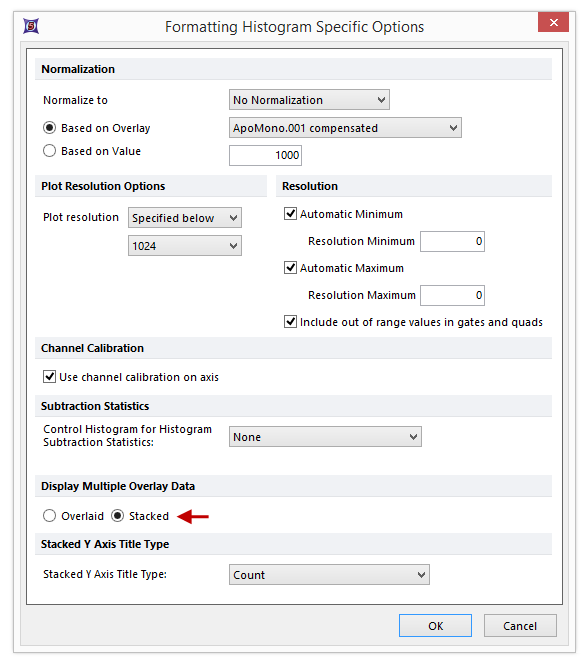
A Formatting Histogram Specific Options dialog will appear (Figure T3.28).
| 3. | Check Stacked from the Display multiple overlay data section ( |
| 4. | Click OK. |

Figure T3.28 Format Histogram (Stacked Overlays)
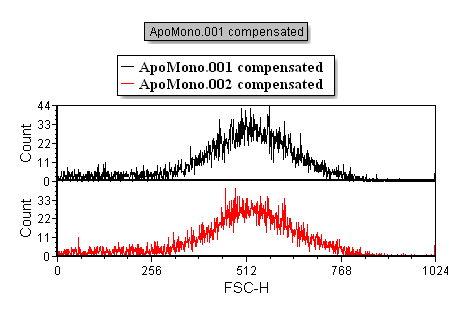
The histogram will change to stacked (Figure T3.29).

Figure T3.29 Stacked Histograms
To change the histogram overlays back to overlaid press Ctrl+Z on your keyboard.
Alternatively repeat steps 1-4 selecting Overlaid from the Display multiple overlay data section (![]() ).
).
The histogram will change back to the overlaid style (Figure T3.26).
Certain plots can be formatted in 3D.
